08.12.2026

How to find North Carolina real estate leads before they list

North Carolina’s price line barely moved between July 2023 and July 2026. The statewide median went from $363,000 to $369,000 to $375,000, then held there. What it costs to keep the house did not hold. Approved homeowners insurance base rates rose 7.5% in June 2025 and another 7.5% in June 2026, and roughly 32% across those two years in the beach territories of Brunswick, New Hanover, Pender, Onslow, and Carteret. Reappraisal notices go out somewhere in the state every year, by statute.

That gap is where North Carolina real estate leads start. An owner who opens a renewal notice or a new assessed value runs the math on their house months before they mention it to anyone, and that math is where the decision to sell gets made. No one sees it happen. The agent already in front of that owner is not competing for the listing. Everyone else meets the seller at the sign.

North Carolina’s housing market is steady, and eight years of data show it
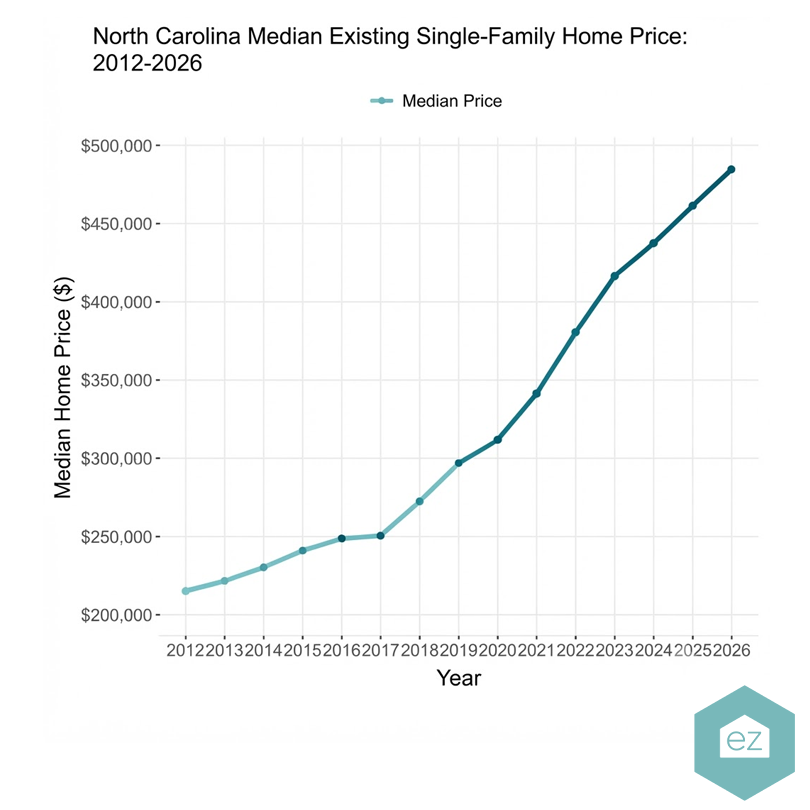
Line graph showing North Carolina real estate leads as median single-family home prices rise from about $200,000 in 2012 to nearly $500,000 projected in 2026.

North Carolina runs a large market that fluctuates rather than trends. Financed home purchases statewide averaged roughly 168,000 a year from 2018 through 2025 in the federal Home Mortgage Disclosure Act data published by the Consumer Financial Protection Bureau. The series peaked at 207,231 in 2021 and settled into a band near 145,000 to 150,000 from 2023 through 2025. Those counts cover financed purchases only, so every cash buyer sits on top of them.

Price tells the same story from a different angle. The nonpartisan Fiscal Research Division of the North Carolina General Assembly tracks the state’s median existing single-family price back to 1993, and that median rose in every one of the years from 2012 through 2023, climbing from a post-crisis low of $149,941 in 2011 to $359,191 in 2023. NC REALTORS put the statewide median at $375,000 in July 2026, the same figure it recorded in July 2025.

Supply is the number that moved. NC REALTORS measured 6.03 months of inventory statewide in July 2026 and treats six months as the mark of a balanced market. Agents hear inventory and sales used interchangeably, and they are not the same measure. Inventory counts what sits on the market at a single moment. Sales count what closes over a stretch of time. North Carolina inventory climbed back toward balance. Sales held their band. Those are different facts, and only one of them changed.

Underneath both sits demand that keeps arriving. The Census Bureau put North Carolina at 11,197,968 residents on July 1, 2025, up 757,000 since April 2020, a 7.2% gain and the sixth fastest in the country. State Demographer Michael Cline reported 84,000 more people moving in from other states than moving out between July 2024 and July 2025, the largest net domestic gain of any state that year. Read that against 11.2 million residents and 4.28 million households and it matters without being the whole story. Net domestic migration ran 104,000 in the 2020 to 2021 stretch, so the pattern is persistent and moderating rather than a spike. Carolina Demography at UNC Chapel Hill found net international migration lower in all 100 counties in 2025 than in 2024, which is the main reason statewide growth eased.

Builders responded. North Carolina authorized 86,167 housing units by building permit in 2025, third among all states, in the Census Bureau’s building permits survey. Every one of those units becomes somebody’s listing eventually.

Employment is broad rather than propped on a single anchor. Across 2025 the strongest gains came in construction at 3.0%, in education and health services at 2.6%, and in other services at 2.6%. The Belk College of Business at UNC Charlotte, forecasting in December 2025, projected 80,800 net new jobs for the state in 2026 with all 14 nonagricultural sectors growing. The North Carolina Department of Commerce’s 2024 to 2034 projections reach further out and name health care and social assistance as the leading source of new jobs in most of the state’s regions, with professional and technical services, finance and insurance, and accommodation and food services adding jobs across multiple regions.

None of that describes a market in trouble. It describes one that stopped sprinting.

Ten counties hold close to half of North Carolina’s people, and 90 hold the rest
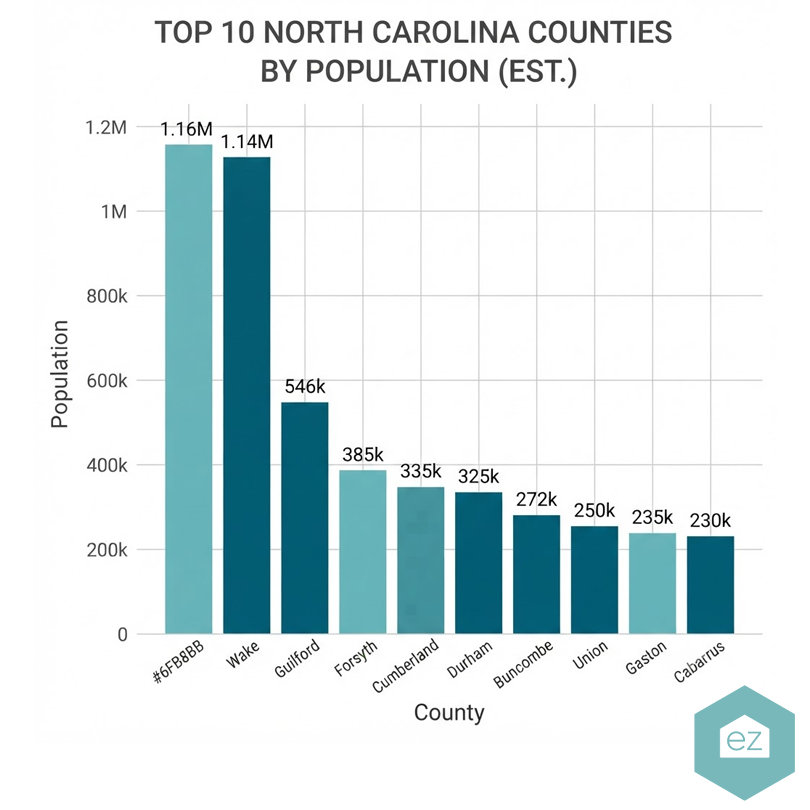
Bar graph showing estimated populations of the top 10 North Carolina counties—valuable insight for North Carolina real estate leads, with Wake and Mecklenburg both over 1 million.

Ten of North Carolina’s 100 counties hold close to half the state’s population, and Wake and Mecklenburg by themselves hold roughly a fifth. That concentration is why a statewide average is nearly useless for planning a farm. The population figures below come from the North Carolina Office of State Budget and Management’s certified estimates for July 1, 2024, the same file county governments are funded on.

CountyPopulation, July 1, 2024Principal cityOther municipalities
Wake1,235,748RaleighCary, Apex, Wake Forest, Holly Springs, Fuquay-Varina, Garner, Morrisville, Knightdale, Wendell, Zebulon
Mecklenburg1,204,215CharlotteHuntersville, Cornelius, Matthews, Mint Hill, Davidson, Pineville
Guilford555,569GreensboroHigh Point, Summerfield, Oak Ridge, Stokesdale, Pleasant Garden, Jamestown
Forsyth399,059Winston-SalemKernersville, Clemmons, Lewisville, Walkertown, Rural Hall
Durham343,108DurhamLargely unincorporated outside the city, with a slice of Chapel Hill
Cumberland341,758FayettevilleHope Mills, Spring Lake, Eastover, Stedman, Wade
Buncombe279,533AshevilleBlack Mountain, Woodfin, Weaverville, Biltmore Forest, Montreat
Union266,672Monroe, the county seatIndian Trail, Waxhaw, Stallings, Weddington, Wesley Chapel, Unionville
Johnston247,249Smithfield, the county seatClayton, Selma, Archer Lodge, Benson, Wilson’s Mills, Four Oaks
Cabarrus246,683ConcordKannapolis, Harrisburg, Midland, Mount Pleasant

Two more counties sit right on that line. New Hanover, at 244,809, and Gaston, at 244,800, are separated by nine people, and Wilmington and Gastonia could hardly behave less alike as markets.

Two details in the table catch outsiders every time. Union County‘s seat is Monroe at 39,256 residents, but Indian Trail is the larger town at 45,045. Johnston County‘s seat is Smithfield at 12,373, and Clayton is two and a half times that size at 31,312. An agent who talks to a Union County seller about “the Monroe market,” or to a Johnston County seller about “the Smithfield market,” has just told that seller something unflattering about how well they know the ground.

The same table is an argument for territory. Wake and Mecklenburg are large enough that no single agent will ever be the recognized name across either one. The other eight are the size where one name can carry a county, and the twenty counties below them are more so.

Only one agent, team, or brokerage holds a North Carolina county on the ez Home Search platform at a time, and the roster changes every month. It takes a minute to check whether yours is still open.

Your North Carolina buyer is usually your next listing
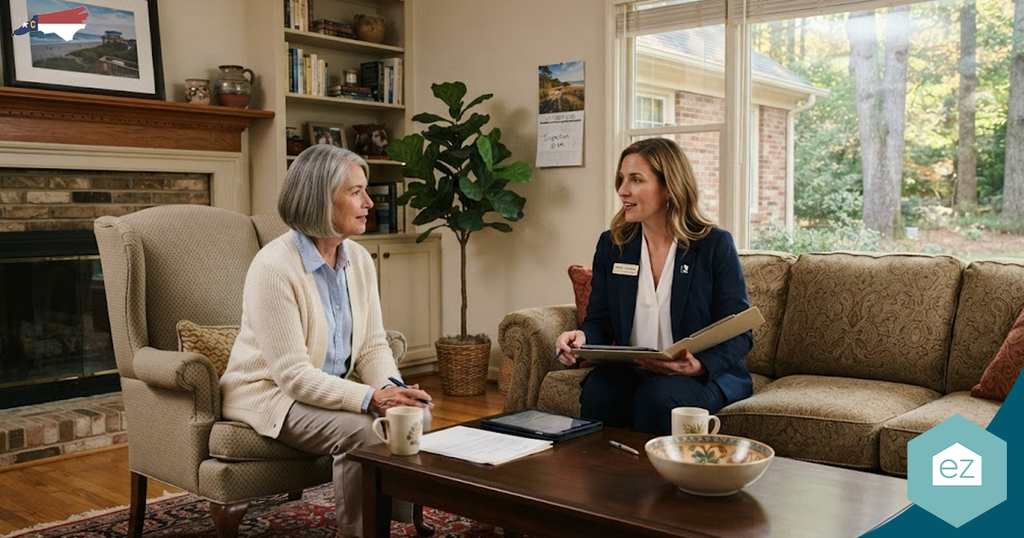
Two women discuss North Carolina real estate leads in a sunlit living room, with notebooks, mugs, and papers on the coffee table between them.

Most agents work one side of a move and lose the other half of it. The seller playbook says market “list with me” and chase expireds. The buyer playbook says buy leads and hope one converts. Both treat a single household’s move as two different customers in two different campaigns.

The numbers say otherwise. The National Association of Realtors’ 2025 Profile of Home Buyers and Sellers, covering transactions between July 2024 and June 2025, put first-time buyers at 21% of purchases nationally, the lowest share since the association began tracking in 1981. That leaves 79% of buyers already owning a home they will sell in order to buy the next one. The same survey recorded a median age of 40 for first-time buyers and 62 for repeat buyers, both records. Those are national figures, and no comparable North Carolina series exists.

On any single house the buyer and the seller are two different people. Across a move they are usually the same person, and that person shows up as a buyer first.

None of that describes a state without sellers. The Census Bureau counts 4,282,345 households in North Carolina and puts owner occupancy at 66.6%, which works out to roughly 2.85 million owner households. Against a financed-purchase band of about 145,000 to 150,000 a year, something near 5% of North Carolina owners transact in a given year. The other 95% still live in the house, still watch the value, and still reach a life event eventually. About 12.7% of North Carolinians lived somewhere else a year earlier on the American Community Survey’s 2020 to 2024 average, so movement inside the state runs constantly.

The agent’s advantage comes from knowing which side of the move is live at any given moment. ez Home Search reads what a person does on the platform. Run a valuation twice, open the home-value page again, pick an old saved search back up, and the selling half of the move has surfaced. Build new searches, open every alert the day it lands, ask for a tour, and the buying half is in motion. Most people do both, one after the other, and the platform tracks the handoff rather than guessing at it.

That is also why the automated valuation model (AVM) carries more weight than it appears to. It gives a buyer a reason to come back to their agent’s co-branded platform for years after closing, watching a number that belongs to them. By the time that buyer becomes a seller, the agent is already the person they check with.

Carrying cost is the North Carolina listing trigger most agents are not working
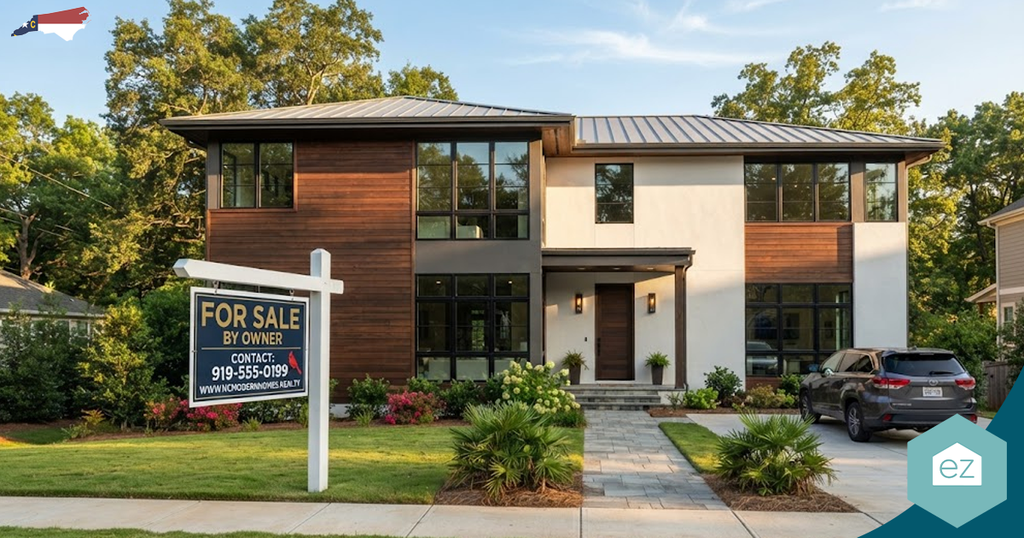
Modern two-story house with large windows and a “For Sale By Owner” sign, perfect for North Carolina real estate leads; SUV in driveway, surrounded by trees on a sunny day.

In North Carolina the cost of keeping a house moves on a schedule the price does not follow, and both schedules are set by mechanisms that will not go away.

Start with insurance. North Carolina sets homeowners rates through a single statewide filing by the North Carolina Rate Bureau, which the Insurance Commissioner can accept, negotiate, or send to hearing, and that filing carries territory factors treating the beach counties differently from everywhere else. The structure guarantees one thing. Whenever rates move, coastal owners absorb the largest share of the move. The Rate Bureau sought an average of 42.2% statewide, with proposals reaching 99.4% in some coastal territories. Commissioner Mike Causey settled it in January 2025 at 7.5% effective June 1, 2025 and another 7.5% effective June 1, 2026, an outcome the Department of Insurance valued at roughly $777 million in premium homeowners did not end up paying. In the beach territories of Brunswick, New Hanover, Pender, Onslow, and Carteret counties, the two steps landed near 16% and then 15.9%, close to 32% across the pair. Insurers filed separately for 68.3% on dwelling policies in November 2025.

The tax side is written into statute. Under G.S. 105-286 every North Carolina county must reappraise all real property at least once every eight years. A growing number run a four-year cycle by resolution of their county commissioners, and any county above 75,000 residents has to advance its reappraisal when its sales-assessment ratio drops below 0.85 or climbs above 1.15. The practical result is permanent. In any given year, some North Carolina counties are mailing every owner inside them a new value. Twelve did exactly that effective January 1, 2026, Guilford, Buncombe, Harnett, Onslow, and Pender among them, and the General Assembly then passed Senate Bill 889 in 2026, deferring those values to fiscal 2027-28, so those owners held a new number well ahead of the bill that follows it.

What a percentage increase means depends enormously on where the house sits. The North Carolina Department of Commerce, working from American Community Survey data in June 2025, found that 2.8% of owner-occupied homes statewide are worth $1 million or more, against 6.5% nationally, while Orange County runs 8.0%, Mecklenburg 7.1%, Buncombe 6.0%, Wake 4.9%, Watauga 4.8%, and Dare 4.6%. At the other end of the same state, 24.4% of owner-occupied North Carolina homes are worth under $150,000, and in 22 counties more than half of them are, led by Robeson at 71.5%, Bertie at 71.4%, and Scotland at 67.6%.

A 15% increase is an annoyance in Chapel Hill and a decision in Lumberton.

That decision is the conversation. An agent who can put real numbers on the whole cost of holding a house, taxes and insurance included, is the one that owner calls first. ez Home Search carries property-tax detail down to the state, county, city, and ZIP level and pairs it with the AVM, so the partner holding that county answers with arithmetic rather than sympathy.

Six North Carolina regions, six different jobs for the same lead source

Aerial view of Uptown Charlotte, North Carolina, the center of the 16-county Charlotte real estate region
Mecklenburg County alone accounted for 15,406 of the Charlotte region’s 43,361 closings in 2025.

A lead source that works in Mecklenburg County can fail in Buncombe, because the two regions are solving different problems in the same year.

Greater Charlotte. Canopy MLS counted 43,361 closings across the 16-county region in 2025, 2.9% above 2024, at a median of $399,990. Average days on market ran 51 in 2025 against 39 in 2024. Mecklenburg County by itself did 15,406 sales at a $452,000 median on 2.3 months of supply. The Childress Klein Center for Real Estate at UNC Charlotte adds the part almost nobody quotes. The Charlotte metro added 28,951 housing units in 2024 against 24,837 net new households, a surplus of roughly 4,114 units, and homes selling under $300,000 fell from 35.7% of sales in 2021 to 17.8% in 2025. Supply arrived. It arrived at the top of the price range.

The Research Triangle. Doorify MLS reported 2025 closed sales about 5% below 2024 while new listings rose 2.2% and the median held near $500,000 on roughly $19 billion in volume. Wake and Johnston counties keep adding households, so a softer sales count there is a pricing question rather than a demand question.

The Piedmont Triad and the Carolina Core. Toyota’s battery plant in Liberty, in Randolph County, is a roughly $14 billion project targeting 5,100 jobs at full production in 2030. Boom Supersonic’s $500 million factory in Greensboro targets 1,761. Wolfspeed announced a $5 billion silicon carbide plant in Chatham County in 2022. Those are announced targets rather than delivered headcount, and they are still why Guilford, Forsyth, Randolph, Alamance, and Davidson counties are approving housing they had no use for a decade earlier.

Western North Carolina. Hurricane Helene came ashore in September 2024, and the recovery is still writing that market. Across the 13 mountain counties Canopy MLS covers, November 2025 inventory sat 41% above November 2024 at just over 4,600 homes and 5.5 months of supply, with Buncombe County up 63.2% to 1,578 homes. Buncombe lost 0.6% of its population between July 2024 and July 2025. Homes return there on a rebuilding schedule, one owner at a time, across years rather than quarters.

The Cape Fear coast. Cape Fear REALTORS counted 12,002 closings across the Wilmington metro in 2025, 5.8% above 2024, at a median near $412,000, with cumulative days on market at 82. Brunswick County grew 4.7% between July 2024 and July 2025, the largest percentage gain of any North Carolina county and the seventh largest in the nation. Brunswick also sits inside the beach insurance territory, so its owners carry both stories at once.

The Sandhills and the Fayetteville region. Longleaf Pine REALTORS put the December 2025 median at $299,900, up 4.5% from a year earlier, on 3.6 months of supply, and Cumberland County pending sales in June 2026 ran 17.7% above June 2025. Fort Bragg anchors this one, and Camp Lejeune and MCAS New River in Onslow County, MCAS Cherry Point in Craven, and Seymour Johnson in Wayne run the same cycle across the eastern half of the state. Those moves are scheduled years ahead. Most lead sources still meet the family as a stranger every single time.

RegionCounties at its coreThe trend that defines it
Greater CharlotteMecklenburg, Union, Cabarrus, Gaston, Iredell, Lincoln, Rowan, Catawba, Cleveland, Stanly, AlexanderHousing units outran new households in 2024, and entry-priced sales fell by half over four years
Research TriangleWake, Durham, Orange, Johnston, Chatham, Franklin, Granville, Harnett, LeeSales eased about 5% in 2025 while the median held near $500,000 and inventory widened
Piedmont Triad and Carolina CoreGuilford, Forsyth, Davidson, Randolph, Alamance, Rockingham, Surry, Davie, Stokes, YadkinAnnounced advanced-manufacturing projects targeting thousands of jobs by 2030 are pulling housing approvals forward
Western North CarolinaBuncombe, Henderson, Haywood, Madison, Transylvania, Polk, Rutherford, McDowell, Burke, Jackson, Swain, Mitchell, YanceyPost-Helene rebuilding pushed November 2025 inventory 41% above the prior year, toward 5.5 months
Cape Fear coastNew Hanover, Brunswick, Pender, Onslow, ColumbusFastest county growth in the state alongside the steepest insurance increases in the state
Sandhills and FayettevilleCumberland, Hoke, Harnett, Moore, Robeson, Scotland, Richmond, LeeThe lowest median of the six regions here, on a permanent military relocation calendar

Remote and hybrid work keeps moving buyers into North Carolina’s smaller counties
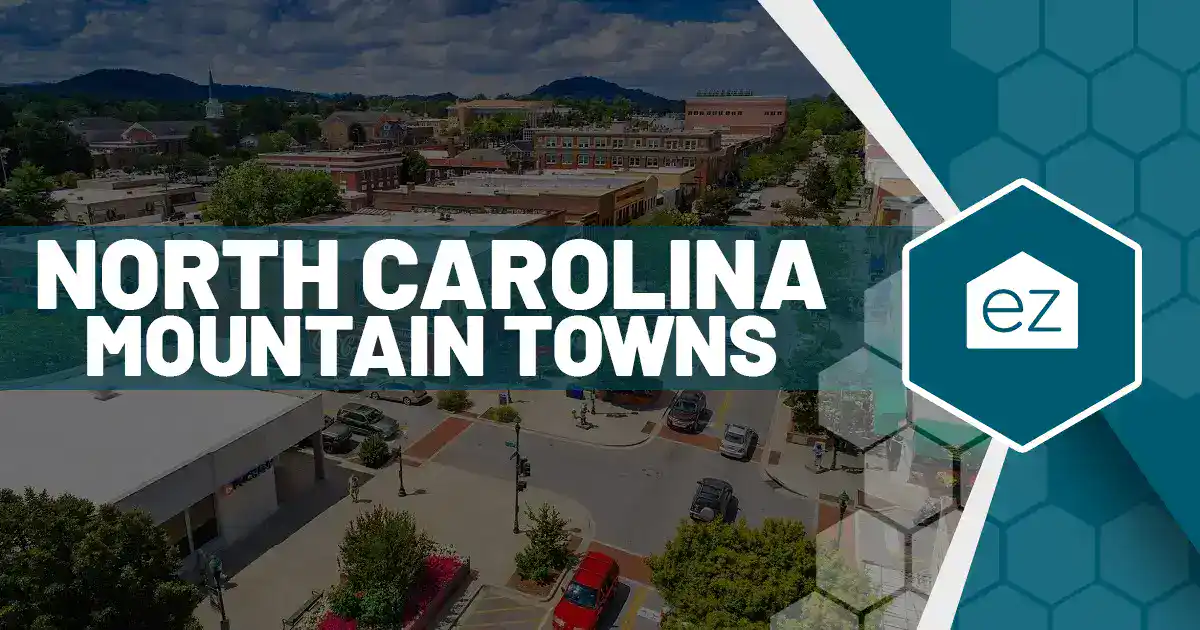
Aerial view of a small North Carolina mountain town with tree-lined streets and residential blocks
North Carolina’s fastest-growing counties are exurban, coastal, and mid-size, not downtown.

Remote work did not die, and the counties positioned to benefit from that are the ones many North Carolina agents have written off.

The return-to-office headlines describe large enterprises rather than the labor market. Teleworking Americans numbered 36.7 million in the final quarter of 2024 by the Bureau of Labor Statistics count, up from 32.5 million four quarters earlier, and the share of workers doing it moved from 20.7% to 23.4% across the same stretch. On the employer side, the Census Bureau surveyed roughly 150,000 firms through its Business Trends and Outlook Survey between November 2024 and January 2025 and found that 31.2% of US businesses had someone working a full day from home, with those same employers projecting the identical level five years out. Those are national figures. They establish the arrangement as a standing feature of how Americans work.

The geography follows the work. Rural America took in 974,000 more people than it sent out between 2020 and 2024 by the USDA Economic Research Service’s count, ending better than ten straight years of losses, and the arrivals skew heavily toward adults aged 25 to 44.

North Carolina is built for that inflow. Its fastest-growing counties between July 2024 and July 2025 were Brunswick at 4.7%, then Iredell, Johnston, and Pender at 2.8%, and Franklin at 2.6%. Not one of them is a downtown. They are exurbs, lake and coastal counties, and mid-size markets an hour or so from a job center that a worker now reaches twice a week instead of five times. The infrastructure is already in place. Some 90.1% of North Carolina households carry a broadband subscription, and the state’s mean commute runs 25.1 minutes, which is short enough that a two-day office week is an easy trade.

For an agent this changes what to show, not only where to prospect. A buyer working out of a Franklin County or Catawba County house wants a dedicated room with a door, or a detached structure or accessory dwelling unit they can work from, or enough square footage for two working adults to split. They will ask about upload speeds before they ask about the elementary school. Answer those questions well and you become the agent in that county for that buyer.

Most agents still treat these counties as spillover from Raleigh and Charlotte. They have been their own markets for years.

One partner holds each North Carolina county on the ez Home Search platform, and counties shaped like these tend to go first. Find out where yours stands.

Beyond the metros is where one name still wins a whole county
Welcome signage for Newton, North Carolina, the county seat of Catawba County
Newton, in Catawba County, is the kind of market where a single recognized name still carries the whole county.

No single agent will ever be the recognized name across Wake or Mecklenburg, and in most of the other 98 counties that position is still open. The eleven below are a fair sample of what that looks like: coastal, mountain, exurban, and small-city markets with real transaction depth and no brand that owns them. Populations are the North Carolina Office of State Budget and Management’s certified estimates for July 1, 2024.

CountyPopulation, July 1, 2024Communities
Iredell207,823Mooresville, Statesville, Troutman, Harmony
Pitt182,572Greenville, Winterville, Ayden, Farmville, Bethel
Brunswick169,448Leland, Oak Island, Southport, St. James, Shallotte
Catawba168,248Hickory, Newton, Conover, Claremont, Maiden
Henderson122,513Hendersonville, Fletcher, Mills River, Flat Rock, Laurel Park
Moore109,962Pinehurst, Southern Pines, Aberdeen, Whispering Pines, Carthage
Craven106,836New Bern, Havelock, Trent Woods, River Bend, Vanceboro
Franklin80,536Louisburg, Youngsville, Franklinton, Bunn
Wilkes65,329North Wilkesboro, Wilkesboro, Ronda
Watauga56,175Boone, Blowing Rock, Beech Mountain, Seven Devils
Dare38,536Kill Devil Hills, Kitty Hawk, Nags Head, Southern Shores, Manteo, Duck

Currituck County belongs on that list with an asterisk. It is one of the few North Carolina counties with no incorporated municipalities at all, so the market is made of communities instead of towns: Moyock, Barco, Coinjock, Grandy, Powells Point, and Corolla out on the northern Outer Banks. Currituck grew about 16% between April 2020 and July 2024. An agent who knows which of those places a buyer actually means has already separated themselves from every out-of-market referral that county receives.

Size is not the point in any of these markets. Moore County moves Pinehurst golf-corridor property, retiree relocation, and Fort Bragg overflow in the same week. Catawba County runs on furniture, fiber optics, and lake property around Lake Norman’s northern reach. Dare County sells second homes to people who live four states away and will never meet their agent in person. Each one supports a full-time practice, and each one rewards the agent whose name is already attached to the place before a buyer starts looking.

That is a different asset from a lead. A lead expires. A county does not.

What North Carolina agents pay for now, and the ceiling on each one

Downtown Raleigh, North Carolina skyline at twilight with light trails along the street below
Wake County is large enough that no single agent will ever be the recognized name across it.

Every method below works, which is exactly why agents keep paying for the ones that stopped scaling.

Shared leads from legacy real estate portals. Volume arrives the day you switch it on, and in Wake or Mecklenburg that volume is real. The limit is structural. The same name goes to several agents at once, so the first conversation is a race rather than an introduction, and the person on the other end is a stranger whose search history you never see. You are buying the right to compete for someone who did not choose you.

Your own IDX site. You own it, and that matters. The limit is time and depth. An IDX site is a slow asset that takes years of content to rank, and it depends on you producing that content forever. The parts that hold a consumer’s attention, minute-level listing updates, an accurate valuation on any property, school and tax detail at the district and ZIP level, sit behind data licensing and engineering that no single team or brokerage funds on its own.

Cold calling, circle prospecting, and expireds. It is cheap, immediate, and entirely inside your control. The limit is legal exposure most agents never price in. The law treats you as a telemarketer from the first dial, and if a recipient disputes consent, the burden of producing proof falls on you rather than on them. A team running a few thousand numbers through a dialer without documented consent has taken on a risk with no ceiling.

Predictive-seller software. It narrows a database to a workable list, which is useful on its own terms. The limit is that a high score is a guess about a stranger. The score does not build the relationship that turns the guess into a listing, and you still have to.

Home-value pages and all-in-one platforms. Each one solves a real thread: an estimate in an inbox, a form on a landing page, a task in a pipeline. The limit is that each is another system you configure, pay for, and operate, and none of them is somewhere a past client goes on their own on a Tuesday night.

Paid search and social. It starts fast and measures cleanly. The limit is that it stops the moment you stop, and the auction in the Charlotte and Triangle markets gets more expensive every year you stay in it.

North Carolina itself raised the cost of getting follow-up wrong. Across the Charlotte region, average days on market ran 39 in 2024 and 51 in 2025, and list-to-close moved from 87 days to 96. Homes sold at 95.7% of their original list price across 2025. That is a market walking back toward its pre-2020 pace, and a longer timeline means more touches, more patience, and more openings to lose a client to whoever stayed in front of them.

That gap is the mechanism ez Home Search runs on. Keep the consumer on a search experience carrying the partner’s brand, watch what they do inside it, and reach them at the moment their own behavior says they are close.

What one partner per county changes in a state with 100 of them

Aerial view of Asheville, North Carolina at sunset with brick homes in the foreground and the Blue Ridge beyond
Buncombe County ended November 2025 with 1,578 homes for sale, 63.2% above the prior year.

One agent, one team, or one brokerage carries the ez Home Search consumer experience across a whole North Carolina county under the Exclusive County Partnership. No second partner works inside those lines. Every opportunity the county produces belongs to the partner who holds it, with nothing billed per lead and nothing taken out of the commission at closing, so a heavy month arrives as income rather than as a larger invoice.

The value shows up at the start of the conversation. When a North Carolina buyer or seller reaches the partner, a record of what they have been doing arrives with them: which neighborhoods they kept circling back to, which price band they stopped leaving, the second valuation they ran on a house, the tour they finally booked. Weeks of trust-building are already behind them. What ez Home Search hears back from the agents and teams running county exclusivity is consistent: these connections convert inside 30 to 60 days.

That readable history exists because people behave differently on a platform they trust. ez Home Search runs as The Only Confidential Home Search, and the promise underneath that phrase is narrow and checkable. Nobody buys a searcher’s contact details or budget. Nothing gets recycled into a list. No crowd of businesses the person never chose hears from them at all. One Single Local Expert serves their county, and the person knows exactly who that is. Confidentiality is the part of A Better Way To Discover Real Estate that ez Home Search had to engineer rather than announce. Consumers say what they are actually planning instead of hiding from a form.

The database the partner already owns. Repeat clients and referrals make up roughly 41% of business across all agents according to the National Association of Realtors, and for the most experienced that share is the majority. Almost nobody captures it, because real follow-up takes content worth opening and a home search a past client returns to without being prompted. ez Home Search builds and runs both, co-branded to the partner, at a quality no single team could fund on its own. ez Home Search’s own measurement puts partner reactivation of past clients, whether as repeat business or as a referral, at 2.5 to 5 times the ordinary market rate.

The listing that walks out of the county. In any given year Census figures have about 2.1% of Americans crossing a state line to move, with roughly another 3% relocating to a different county without leaving their state, and 12.7% of North Carolinians lived somewhere else a year earlier. When a past client starts pricing a move to Charleston or Nashville, that search happens inside the partner’s co-branded experience instead of on a legacy portal, and it registers as a signal. The agent makes contact while the local house is still unlisted. The home they helped that client buy stays the home they sell.

Consent proof on every opportunity. Every opportunity arrives with its consent already on file. ezVerify.ai records the moment a person opts in and keeps the audio. It runs each number past a known-litigator database. Anything sitting on the federal Do Not Call registry gets dropped before a partner dials. The contact record comes back filled in too, so nobody is hunting for a working phone number. The exposure that reaches a working North Carolina agent is a private lawsuit, where every call or text the agent cannot document carries $500, a willful violation runs to $1,500, and no ceiling caps the total. A dispute over consent then meets documentation instead of an argument.

Tools the partner never builds or operates. The AVM widget, the home-value page, the open-house sign-in behind a QR code, the instant cash offer, the listing alerts, and ezNurture follow-up sit on the national ez Home Search platform already, wearing the partner’s brand. Activity intelligence flows into whatever CRM the team already runs, fullest in Follow Up Boss and deepest in Sure Send™, with every other platform carrying what its integration supports. None of it needs configuring, and none of it needs somebody to keep it running.

Then the part that decides it. Only one partner holds a North Carolina county. Many of the state’s 100 are already claimed, and more go every month. The model works the same in Mecklenburg as in Wilkes. The name people already associate with real estate is worth just as much across 65,000 residents as across 1.2 million. The National Association of Realtors’ Profile of Home Buyers and Sellers found 81% of sellers making contact with a single agent and no other before they choose, 77% of repeat buyers interviewing exactly one, and reputation ranking as the top factor for 35% of sellers. Most people never comparison shop. They call the name they already know.

Where a North Carolina agent’s next listing gets decided
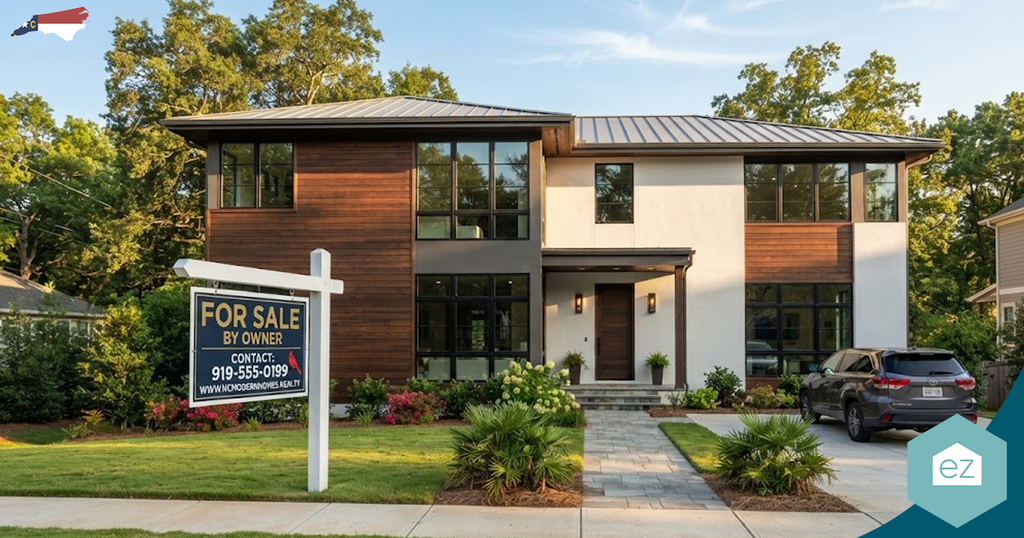
Modern two-story house with large windows, “For Sale By Owner” sign, driveway, landscaping, and car—perfect for generating North Carolina real estate leads. Trees and clear sky in the background.

There are three ways to build a North Carolina pipeline, and only one of them compounds.

Keep buying shared leads. You will get volume, you will get it tomorrow, and you will rebuild the same relationship from zero every year while the auction price climbs underneath you.

Build the platform yourself. License the data, stand up the feeds, hire the engineers, produce the content forever, and in three or four years you may have something a consumer comes back to on their own.

Hold one North Carolina county on a platform that already exists, with your name across it, and work the buyer and the seller inside that county as the one person they usually are.

The middle path has an honest cost, and it is worth naming before you weigh it. Exclusivity cuts both ways. One partner per county means the counties around you belong to somebody else, and it means you carry your county instead of splitting it with three other agents who each do a quarter of the work and blame the leads. A territory you can coast in is not what this is.

One number is worth carrying out of this. A partner on the ez Home Search platform wins back past clients, as repeat business or as a referral, at 2.5 to 5 times the usual market rate. That is revenue those agents had already earned once and were letting slip.

North Carolina counties will mail reappraisal notices next year, and the year after that, and the year after that. Insurance renewals land every twelve months in all 100 of them. Every one of those envelopes starts a conversation at somebody’s kitchen table months before a sign goes in a yard. The only question worth answering is whether your name is already on the screen when that owner goes looking.

Check whether your North Carolina county is still open.

Frequently asked questions

Which North Carolina counties are worth farming when Brunswick grew 4.7% and Halifax lost 1% in the same year?

Growth rate answers one question and owner base answers the other. Brunswick’s 4.7% gain between July 2024 and July 2025 was the largest of any North Carolina county and the seventh largest in the nation, which tells you buyers are arriving there faster than almost anywhere. Halifax lost 1.0% over the same stretch, and it still holds thousands of owner households that turn over on the ordinary schedule of jobs, retirements, inheritances, and divorces.

Pick a county on transaction depth and on whether one name can realistically own it. A fast-growing county gives you buyer flow. A flat county gives you listing flow and far less competition for the recognized-name position.

Does a North Carolina county reappraisal create a seller conversation, and when does the next one reach my county?

It does, and the schedule is public. G.S. 105-286 requires every North Carolina county to reappraise all real property at least once every eight years, a growing number run four-year cycles by resolution of their commissioners, and any county above 75,000 residents must advance its reappraisal when its sales-assessment ratio falls below 0.85 or rises above 1.15. Your county tax office publishes its cycle.

Twelve counties revalued effective January 1, 2026, including Guilford, Buncombe, Harnett, Onslow, and Pender, and Senate Bill 889, passed by the General Assembly in 2026, deferred those values to fiscal 2027-28. That gap is the opening. The conversation is not “your value went up.” It is what the full carrying cost looks like against what the house would bring, which is a question an owner cannot answer alone.

Is western North Carolina worth working through the Helene rebuild?

Yes, and the inventory data is the reason. Across the 13 mountain counties Canopy MLS covers, November 2025 inventory stood 41% above November 2024 at just over 4,600 homes and 5.5 months of supply, with Buncombe County up 63.2% to 1,578 homes. Those homes are returning to market on a rebuilding schedule that runs in years, one owner at a time.

An agent who is present across that whole stretch, rather than showing up when a listing appears, gets the listing. This is the market where staying in front of past clients pays the most and where the fewest agents are set up to do it.

How should a Charlotte-region team change its follow-up when days on market run in the 50s rather than the high 30s?

Move from calendar-based drip to behavior-based outreach. Average days on market across the Charlotte region ran 39 in 2024 and 51 in 2025, list-to-close moved from 87 days to 96, and homes sold at 95.7% of original list price. A longer runway means more touches per transaction and more chances for someone else to be in front of your client on the day they decide.

A list worked top to bottom does not scale to that timeline. A contact who has just run their valuation a second time does.

What does the two-year insurance increase in the Brunswick and New Hanover beach territories change about how I talk to coastal sellers?

It puts insurance in the pricing conversation. Beach territory owners in Carteret, Onslow, Pender, New Hanover, and Brunswick counties absorbed roughly 16% and then 15.9% under the settlement the Insurance Commissioner reached in January 2025, close to 32% across the two steps. Buyers underwrite a monthly payment that includes that premium, so it shows up in what they will offer.

Bring the number to the listing appointment instead of letting a buyer’s lender discover it. A seller who understands why their carrying cost changed prices the home correctly the first time.

How do agents around Fort Bragg and Camp Lejeune keep a military client through a PCS move?

By seeing the move before the listing does. When that family starts pricing housing near their next duty station, the search runs inside their agent’s co-branded ez Home Search experience instead of on a legacy portal, and that shows up on the agent’s side as a signal.

The agent gets in front of it while the current home is still theirs to list, handles the sale in Cumberland, Hoke, Harnett, Onslow, or Craven County, and hands the family to a vetted agent at the new duty station, earning a referral fee on that side. Strip out the national coverage and the same client vanishes, taking the local listing to whoever they found online.


08.11.2026

North Dakota Real Estate Leads Nobody Else Is Calling

The same $250,000 house costs $2,246 a year in property tax in Williston and $4,233 in Devils Lake, both figures before the state’s primary residence credit. The City of Fargo Assessment Department published that 2024 comparison across North Dakota’s twelve largest cities in April 2025. A gap that size sends North Dakota homeowners to look up what their own place is worth. That lookup is the earliest seller signal there is. The North Dakota real estate leads worth having start there, months or years ahead of a listing appointment.

Most North Dakota agents never see that lookup happen, because it runs on a platform they have no connection to. They are working shared names bought from a legacy real estate portal instead, competing for people who never chose them. Someone on a purchased list still has to be convinced they are thinking about a move. The owner who looked up their own value has already done that part, and nobody is calling them.

Most North Dakota buyers are also sellers, and most agents miss the larger opportunity

An agent who buys buyer leads out of one budget line and chases listings out of another is paying twice to reach one North Dakota household, because the people shopping for a home in Bismarck or Minot almost always own one already. The two campaigns run on separate lists with separate messages, and for most of the market they are aimed at the same address.

Nationally, first-time buyers were 21% of the market in the National Association of Realtors’ 2025 Profile of Home Buyers and Sellers, the smallest share since the association began tracking in 1981, and the median first-time buyer reached a record age of 40. That leaves roughly four in five buyers who already own a home they will sell to buy the next one. The share is directional rather than exact, since some repeat buyers have already sold, some keep the old house as a rental and some pay cash. No comparable North Dakota figure is published, so 21% stays a national anchor and the state ratio may sit somewhat above or below it.

On any one house in Fargo, the buyer and the seller are two different people at the same closing table. Across a move, they are usually one person. That person opens the buy side first almost every time, checking what their equity would afford somewhere else months before they will put a sign in the yard, which is why the listing an agent wants in June already existed as a private search in January.

The pattern holds three groups, and only the first of them owns nothing yet. The first-timer needs affordability math, plain explanations and someone willing to answer the same question twice. The four-in-five majority needs the equity in the house they are leaving, the timing between two closings and the next purchase handled as one move. The seller-only owner is a genuine minority: an estate, a landlord exiting a rental, an owner moving in with family. All three are real business, and a plan built on the third group is built on the smallest of them.

ez Home Search reads which side of the move is live and serves that side. A valuation run, an equity question or a home-value page visit opens the seller conversation. Saved searches, opened alerts and a booked tour open the buyer conversation. Most people produce both sets of signals within a single year, and the county partner sees which one arrives first.

An agent working a purchased list hears about the listing when the sign goes up. A partner reading the platform hears about it the day the owner checks what the house is worth.

Who is moving into North Dakota, who is staying, and who owns

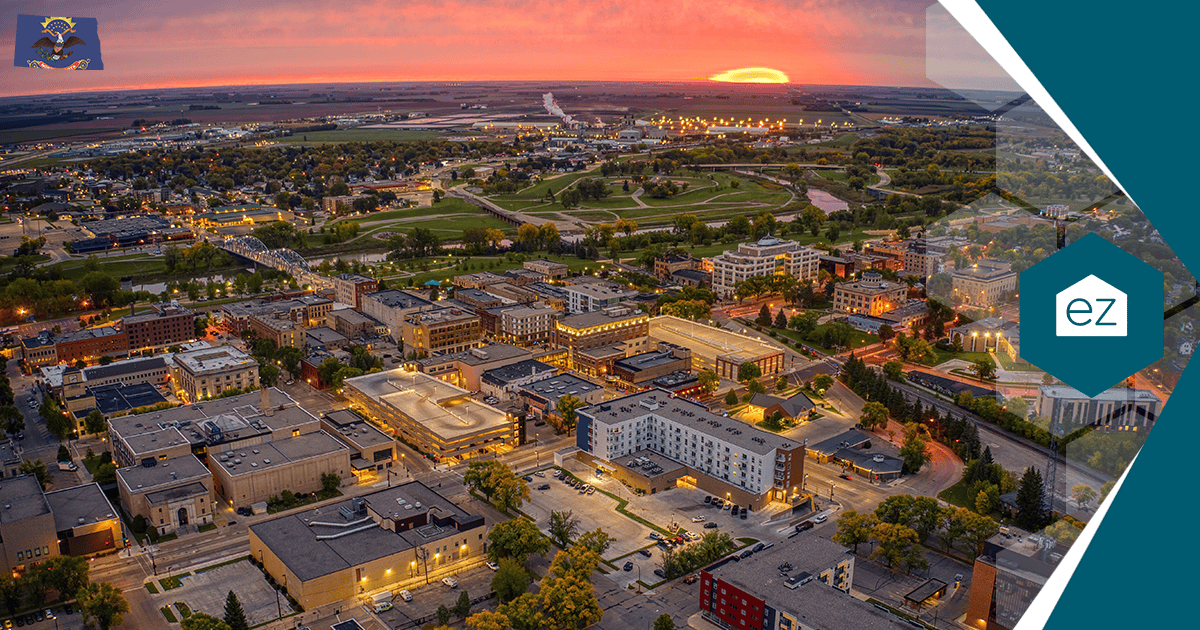
Aerial view of a North Dakota city at sunset, where most of the state's population growth is concentrated
Four counties produced 87% of North Dakota’s population growth in the year to July 2025.

North Dakota’s newcomers arrive mostly from Minnesota and from other countries, six in ten residents were born in the state and stayed, and a clear majority of households own the home they live in. The state reached 799,358 residents on July 1, 2025. That is 5,971 more than a year earlier, growth of 0.8% against a national rate of 0.5%, and 14th among the states, per Census Bureau Vintage 2025 estimates published through NDCompass. The state has grown every year since a slight dip in 2020 to 2021.

Migration supplied 56% of that gain: net migration of 3,322, of which international arrivals accounted for 2,810 and domestic in-migration for 512. Births ran 9,760 against 7,130 deaths, adding 2,630 more. North Dakota is one of 33 states where births still outnumbered deaths in that period.

In 2024, 27,348 people moved into North Dakota from another state and 21,106 moved out, with 5,699 more arriving from abroad. Roughly 48,000 people crossed the state line in one direction or the other in a single year, against a base of about 348,000 households. Minnesota is the largest source and the largest destination, 7,088 in and 6,171 out. Minnesota-born residents are already the largest out-of-state group in North Dakota, 82,420 people, one in ten of the population. A Fargo or Grand Forks partner is working both ends of one corridor.

Each departure is a listing and a relocation referral. A household leaving Grand Forks for Minneapolis is one listing on this side of the border and one referral fee on the other, for whichever agent sees the move before it is announced. Each arrival is a household that needs somewhere to live, and North Dakota takes in more of them than it sends out every year. The only thing that decides which agent gets either one is who knew first.

Of the 14 counties with more than 10,000 residents, 11 gained population between 2024 and 2025, while 24 of the 39 counties under 10,000 lost. Four counties produced 87% of the statewide gain: Cass added 2,523 residents, Williams 1,012, Grand Forks 868 and Burleigh 804. Those four sit in four different parts of the state, and the other 49 counties netted 764 residents between them. The three larger counties that did not gain moved by 100 people or fewer, a difference that says nothing about how many homes trade there.

Owner-occupied homes were 61% of North Dakota’s occupied housing in 2024, down from 67% in 2010, and renter households numbered 135,819, or 39% of occupied units, up from 33%. The drop was steepest among moderate incomes: households earning $50,000 to $74,999 fell from 77% owner-occupied to 53%, and households earning $35,000 to $49,999 fell from 64% to 42%. The renter count rose 17.5% between 2022 and 2024 alone, roughly 20,000 additional households. Those 20,000 are the state’s next first-time buyers. An agent can be the name they already know years before any of them is ready to sit down with one, and almost no lead source in the state is built to reach a person that early.

Where growth lands and where the owners already live are two different maps. Ten counties hold most of North Dakota’s residents. Each one carries a principal city and a set of smaller communities an agent works by name.

CountyPopulationPrincipal city (county seat)Other named communities
Cass193,400FargoWest Fargo, Horace, Casselton, Mapleton, Harwood
Burleigh100,600BismarckLincoln, Wilton
Grand Forks72,923Grand ForksLarimore, Thompson, Northwood
Ward68,973MinotBurlington, Surrey, Kenmare, Berthold
Williams39,555WillistonTioga, Ray, Epping
Morton33,777MandanNew Salem, Hebron, Glen Ullin
Stark33,302DickinsonBelfield, Richardton, South Heart
Stutsman21,549JamestownMedina, Buchanan, Pingree
Richland16,584WahpetonHankinson, Lidgerwood, Wyndmere
McKenzie14,321Watford CityAlexander, Arnegard

Table 1. County population: US Census Bureau, American Community Survey 2024 five-year estimates.

North Dakota has 53 counties, and the ez Home Search Exclusive County Partnership puts one agent, team or brokerage in each of them, whether that county added 2,523 residents last year or held steady. Check whether yours is still open.

Four expanding North Dakota industries tell you which counties gain households, and when

An oil pumpjack and storage tanks on a North Dakota field, part of the state's steady Bakken production
Oil output held near 1.129 million barrels a day in early 2026, with 96.2% of it from the Bakken and Three Forks.

Four North Dakota industries are expanding at once, and each puts households into a named county on a public schedule, years ahead of the first moving truck.

Energy is the one already in place. North Dakota produced 1.129 million barrels a day in February 2026, slightly above January, with 96.2% of it from the Bakken and Three Forks formations, and the rig count sat at 26 after holding in the mid to high twenties since July 2025. The North Dakota Department of Mineral Resources projected roughly flat output for 2026. Oil now sits underneath a much larger economy: real state GDP rose from $38.7 billion in 2010 to $60.3 billion in 2023 (NDCompass).

Data centers are the newest of the four, and in Dickey County the workers got there first. Applied Digital’s Ellendale campus runs a 380,000 sq ft high-performance computing facility, with two further 900,000 sq ft expansions and roughly $5 billion committed across them. More than 2,000 construction workers came for it. The state’s Rural-Workforce Initiative to Support Housing funded its first project there, 20 single-family rental homes and a 38-unit apartment building backed by $3.5 million in private equity and a $3.5 million Bank of North Dakota loan, in a program open only to communities of 20,000 residents or fewer. The company broke ground in September 2025 on Polaris Forge 2, a $3 billion, 280-megawatt campus near Harwood in Cass County, and Oliver County has been evaluated for a third.

Agristo, a Belgian potato processor, is building its first US plant in Grand Forks, and the first crop it processes will come off the 2029 harvest. The plant will employ 300 to 350 people at full operation. Grand Forks adopted a 20-year, 90% payment in lieu of taxes for it after a public hearing on July 21, 2025, and House Bill 1332 created a $30 million Agriculture Diversification and Development Fund the company can apply to. The investment figure is not settled: the Grand Forks Region EDC announced $450 million in 2025, and later trade coverage reports more. The jobs and the dates are what an agent can plan around.

Minot Air Force Base carries the longest calendar of the four. The country’s only dual-wing nuclear installation is preparing to host the LGM-35A Sentinel intercontinental ballistic missile in place of the Minuteman III, on a fiscal 2026 to fiscal 2040 timeline. Roughly $5 billion in construction is planned, with initial activity expected in 2027. At Grand Forks Air Force Base, the Space Development Agency may add 300 to 800 service members.

The wage attached to the job tells an agent the price bracket before the first conversation. Job Service North Dakota figures, published by the state housing finance agency, put average annual pay at $124,956 in mining and oil and gas extraction, $75,192 in construction and $69,368 in manufacturing. Healthcare and social assistance averages $62,972, retail trade $37,544, and accommodation and food services $23,660. Healthcare is the state’s largest employer by headcount and food service is fourth, so the county taking in a Sentinel contractor is also housing the people who will staff its clinics and restaurants.

An agent who starts on Ward County when Sentinel work begins in 2027 is starting the same year as everyone else.

Why a statewide North Dakota average tells an agent almost nothing about their county

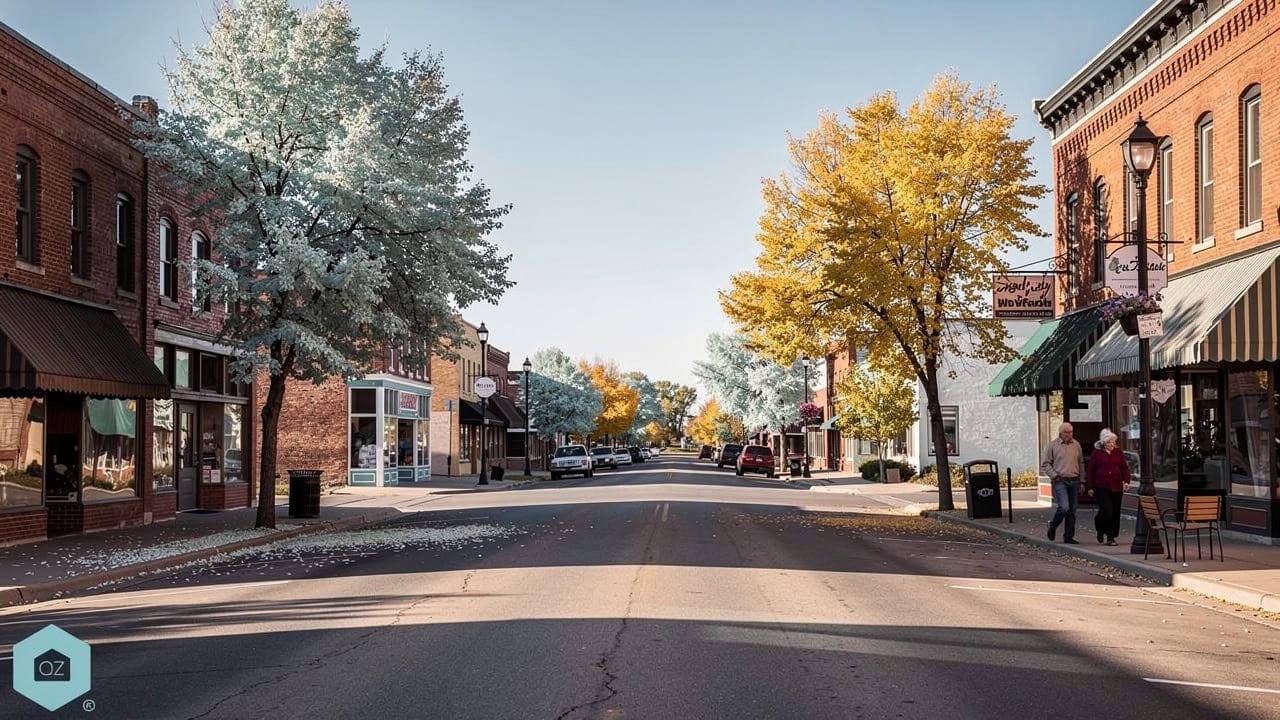
Autumn main street in Valley City, North Dakota, lined with brick buildings
Valley City, the Barnes County seat, where an identical home carries a 1.50% effective property tax rate.

Rural home prices grew 88% in the Devils Lake region from 2010 to 2020 and 372% in the Williston region over the same decade, per the NDSU Center for Social Research. One statewide average tells a North Dakota agent almost nothing about the county they work.

Household formation splits on the same lines: Billings County recorded 4.5 births for every death and Oliver County 4.0, both signs of young families arriving, while Wells, Pierce and Griggs counties each recorded 0.4. Those are two different businesses. One is a market of school-age children, move-up demand and referrals that build on each other. The other is an estate and downsizing market, where the listing decision often gets made by an adult child two states away.

Residential taxable valuation across North Dakota totaled $2,418,437,099 in 2024, per the Office of State Tax Commissioner. Cass County carried $712,434,809 of that. Slope County carried $219,833. The largest residential base in the state runs more than 3,000 times the smallest. North Dakota computes taxable value as 4.5% of true and full value, a 50% assessment ratio followed by a 9% residential factor, so the comparison that holds is base against base, not base against the price of a house.

The one closed-sales count a North Dakota government body publishes covers a single city and a single year. The City of Fargo Assessment Department recorded 1,752 residential sales inside Fargo in 2024, 5% more than the year before, at a median single-family price of $353,500. That figure describes Fargo and nothing outside it, which is why an agent in Ramsey or Mercer County reads their own market one owner at a time rather than from a published series.

The state groups its 53 counties into eight statutory planning regions, each with a regional council its towns work through on housing and infrastructure.

RegionCouncilCountiesSourced trend
I (Williston Basin / Bakken)Tri-County Regional Development CouncilDivide, McKenzie, Williams1.129 million barrels of oil a day statewide in February 2026, 96.2% from the Bakken and Three Forks, 26 rigs, flat output projected for 2026 (ND Department of Mineral Resources). Williams County added 1,012 residents in the year to July 2025 (Census).
II (North Central / Souris Basin)Souris Basin Planning CouncilBottineau, Burke, McHenry, Mountrail, Pierce, Renville, WardMinot Air Force Base is preparing to host the LGM-35A Sentinel on an FY2026 to FY2040 timeline, roughly $5 billion in planned construction, initial construction expected 2027 (Minot Daily News, April 2026).
III (Lake Region)North Central Planning CouncilBenson, Cavalier, Eddy, Ramsey, Rolette, TownerRural price growth in the Devils Lake region ran 88% from 2010 to 2020, the slowest among the rural regions (NDSU Center for Social Research). Benson County poverty fell 6 points between the 2015 to 2019 and 2020 to 2024 five-year estimates (NDCompass).
IV (Northern Red River Valley)Red River Regional CouncilGrand Forks, Nelson, Pembina, WalshGrand Forks County added 868 residents in the year to July 2025; the Space Development Agency may add 300 to 800 service members at Grand Forks Air Force Base; every Spark Building Initiative home built in Lakota and Larimore sold before completion (Census; Grand Forks Herald; North Dakota Monitor).
V (Southern Red River Valley)Lake Agassiz Development GroupCass, Ransom, Richland, Sargent, Steele, TraillCass County added 2,523 residents in the year to July 2025, the largest gain in the state; Applied Digital broke ground September 2025 on a $3 billion, 280-megawatt campus near Harwood (Census; company release).
VI (South Central)South Central Dakota Regional CouncilBarnes, Dickey, Foster, Griggs, LaMoure, Logan, McIntosh, Stutsman, WellsEllendale in Dickey County hosts a roughly $5 billion Applied Digital campus with more than 2,000 construction workers, plus the state’s first R-WISH workforce housing project, 20 homes and 38 apartments (Governor’s office). Barnes County lost 100 residents and Stutsman County 31 in the year to July 2025 (Census).
VII (Missouri River / Bismarck-Mandan)Lewis & Clark Development GroupBurleigh, Emmons, Grant, Kidder, McLean, Mercer, Morton, Oliver, Sheridan, SiouxBurleigh County added 804 residents in the year to July 2025; Oliver County records four births for every death and has been evaluated for a third Applied Digital campus (Census; NDCompass; Valley News Live).
VIII (Southwest / Badlands)Roosevelt Custer Regional CouncilAdams, Billings, Bowman, Dunn, Golden Valley, Hettinger, Slope, StarkBillings County recorded the state’s highest birth-to-death ratio at 4.5, reflecting in-migration of young families; Slope County has the state’s lowest poverty rate at 5% (NDCompass).

Counties are the unit that matters here, and inside most of them the business sits in four or five named towns rather than one.

CountyCommunities
WalshGrafton (county seat), Park River, Minto, Hoople
NelsonLakota (county seat), Michigan, McVille, Pekin
BarnesValley City (county seat), Litchville, Oriska, Kathryn
RamseyDevils Lake (county seat), Edmore, Crary, Starkweather
MountrailStanley (county seat), New Town, Parshall, Plaza
RoletteRolla (county seat), Belcourt, Dunseith, St. John
PembinaCavalier (county seat), Pembina, Walhalla, Neche
TraillHillsboro (county seat), Mayville, Portland, Hatton
MercerStanton (county seat), Beulah, Hazen, Zap
DickeyEllendale (county seat), Oakes, Fullerton, Monango
McLeanWashburn (county seat), Garrison, Underwood, Turtle Lake
BottineauBottineau (county seat), Westhope, Willow City, Newburg

In a town where nothing new has gone up in years, an appraiser works from sales of older existing homes, because those are the comparables the town has. Those sales can put a new build below what it cost to construct, and the builder covers the difference. The Red River Community Housing Development Organization answered that by becoming the developer itself, building through its Spark Building Initiative on lots donated by towns under 5,000 residents. Executive director Lisa Rotvold gave the North Dakota Monitor the numbers in May 2026: an appraisal gap of about $30,000 a home in the first round, $15,000 in the second, $7,000 in the third. Those are one organization’s figures for its own program. The mechanism holds regardless of the exact figures, because each completed sale creates the comparable the next build needs.

Every home the initiative finished in Lakota and Larimore sold before construction was done. Amie Vasichek, the city auditor in Lakota, a town of almost 700, told the North Dakota Monitor in May 2026 that her office fields calls all the time about housing availability, rentals and ownership alike. Peyton Cole-Markel, a Hoople city council member, told the same reporter that people driving through her town of around 200 have stopped locals on the street to ask whether they know of any houses for sale. Those calls are the first move in a sale, and a city auditor takes them because no agent in either county holds that position.

Remote and hybrid work is still a buying signal in North Dakota’s smaller counties

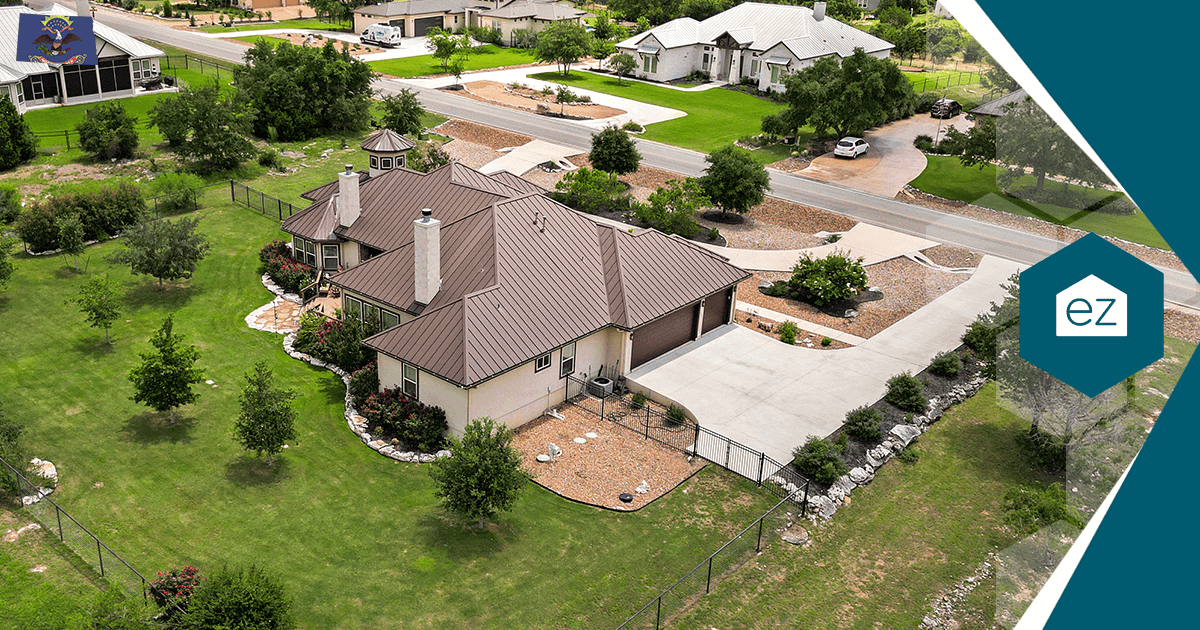
Aerial view of a single-family North Dakota home with a large yard and driveway
Remote and hybrid households shop for square footage and a closable office outside the metros.

Remote and hybrid work still moves households into North Dakota’s smaller counties, and the federal agencies that count it show the level holding rather than falling. Coverage announcing the end of remote work measures the present against the spring of 2020, when roughly 61% of paid workdays in the United States happened at home. Bureau of Labor Statistics figures show 36.7 million people teleworking at least part of the time during the fourth quarter of 2024. A year earlier the count was 32.5 million, and the telework rate across those two quarters rose from 20.7% to 23.4%. Those are national figures. No North Dakota equivalent exists.

Employers are planning around it. The Business Trends and Outlook Survey run by the Census Bureau put work-from-home questions to roughly 150,000 US firms between November 2024 and January 2025, and 31.2% of them reported at least one employee working a full day from home. Asked to look five years out, those same employers projected almost exactly the level they already had. That survey is national too. The five-year projection is the part that matters most to an agent, because a household choosing a county is betting on what its employer will still allow years from now.

A household with that kind of job, comparing places in North Dakota, is comparing the Red River Valley exurbs outside Fargo, the Missouri River corridor towns above and below Bismarck, the Lake Region, and the Drift Prairie counties in between. Each of those gives a budget more room than Fargo or Bismarck does. Across the country, rural counties took in a net 974,000 migrants between 2020 and 2024, according to the USDA Economic Research Service, and that inflow concentrated in adults aged 25 to 44, the age band most likely to hold a remote-capable job.

For a partner holding one of those counties, this is local demand that no single employer’s hiring plan can switch off. It also changes what the partner needs to know about the housing stock, because remote buyers ask for a dedicated office or a room with a door that closes, a separate structure or an accessory dwelling unit, more square footage than the metro price bought them, and broadband that holds a video call. In parts of North Dakota that last item is a live question rather than a formality, and the agent who can answer it address by address is ahead of the tour.

Most of the market has not priced this in. Agents, teams and brokerages read the return-to-office coverage, file the remote buyer under 2021, and keep working the same in-town list. A household that can earn its income anywhere still has to live somewhere specific, and in North Dakota that somewhere is a county where one partner sees the search happen.

What North Dakota agents use for leads now, and where each one runs out

Woman at her desk attends a video call about North Dakota real estate leads, using a stylus on a tablet and two monitors; notebook and microphone are also on the desk.

Six approaches do most of the lead generation in North Dakota, and each one runs out somewhere different. Shared leads bought from a legacy real estate portal arrive in volume, and they arrive the same week an agent turns the spend on. The limit is structural: the same name goes to several agents, the person chose none of them, and their contact details and budget were routed somewhere they never picked.

An IDX site is an asset the agent owns, and a well-built one gives clients a full search experience under the agent’s own name. It grows slowly. The valuation modeling, the school data and the property tax depth behind a national platform sit outside what one team can build, and the site reaches only the people who already know the address to type.

Cold calling and circle prospecting still produce listings, and in a county of a few thousand people the agent often knows the person who picks up. Compliance is where this one runs out. Under the Telephone Consumer Protection Act, an agent who prospects by phone or text is treated as a telemarketer, and when a recipient disputes consent, the burden of proving it falls on the caller for every number dialed. Each call or text without that proof carries $500, or up to $1,500 for a willful violation, and nothing caps the total. The Federal Trade Commission logged more than 2.6 million Do Not Call complaints in fiscal year 2025 alone, up from the year before.

Every opportunity ez Home Search sends a partner comes with ezVerify.ai behind it. It verifies that the person opted in, holds the recording that proves it, checks the number against a known-litigator database, suppresses numbers on the Do Not Call registry, and fills in the detail on the contact before anyone dials. What arrives is documentation. A score estimates who might sell; a recording proves who agreed to be called.

Predictive-seller software narrows a list, which is genuine help on a database of thousands. Its accuracy depends on transaction volume. In a North Dakota county where a few dozen homes change hands in a year, the model has almost nothing to work with. Comparable sales are scarce enough across the rural parts of the state that valuation itself is hard, and those properties routinely mix residential, agricultural and commercial elements that standard categories miss. A high score in that setting is a guess, and someone still has to build the relationship that turns it into a signed listing.

A generic all-in-one CRM puts contacts, campaigns and tasks in one system. That beats running four. Someone still has to configure it and keep it running, and in a small brokerage that someone is the agent, at night. A past client has no reason to return to it on their own.

The content an agent writes and the ads an agent buys both reach households no referral would have reached. Paid reach stops when the spend stops. Most agents cannot produce something worth opening every month while also serving clients spread across an hour of driving.

ez Home Search works through a mechanism none of the six uses. People choose the platform themselves. Their own activity on it is what connects them to the one partner who holds their county, so the connection is never sold to several agents at once.

One partner holds each of North Dakota’s 53 counties. Check whether yours is open.

What North Dakota property taxes tell you about who is thinking of moving

A North Dakota homeowner reviewing property documents at her kitchen table during winter
An owner checking what their home is worth is the earliest seller signal an agent can act on.

A North Dakota homeowner who looks up what their house is worth is telling you they are thinking about moving, and property tax is what sends them looking more often than anything else in this state. Voters put a measure on the 2024 ballot to abolish property taxes based on assessed value. It failed. The Legislature read the result and made property tax relief the top priority of the next session. A former mayor of Horace told the Tax Reform and Relief Advisory Committee in March 2026 that there is “a lot of tax fatigue” in North Dakota communities.

On the same $250,000 home, an owner in Devils Lake pays 88% more property tax than an owner in Williston. Table 4 sets out the 12 largest cities, from the City of Fargo Assessment Department’s annual report to the Fargo City Board of Equalization, April 8, 2025. Every figure in it is the gross tax, before the state’s primary residence credit.

CityEstimated 2024 tax on a $250,000 homeEffective residential rateTotal mills
Williston$2,2460.90%199.60
Bismarck$2,8961.16%257.38
Dickinson$2,9261.17%260.10
Mandan$3,1551.26%280.47
West Fargo$3,2621.30%289.92
Fargo (School District #1)$3,3551.34%298.18
Valley City$3,7431.50%332.72
Jamestown$3,7861.51%336.56
Minot$3,8451.54%341.76
Grand Forks$3,8991.56%346.54
Wahpeton$3,9331.57%349.60
Devils Lake$4,2331.69%376.26

Table 4. Estimated 2024 property tax on a $250,000 residence across North Dakota’s 12 largest cities, before the primary residence credit. Source: City of Fargo Assessment Department, annual report to the Fargo City Board of Equalization, April 8, 2025.

One mill is a dollar of tax for every $1,000 of taxable value, and taxable value is only a slice of what a house would sell for. North Dakota assesses a residence at 50% of market value and then applies a 9% residential factor, which leaves $11,250 of taxable value on a $250,000 house. Williston’s 199.60 mills against that $11,250 produce the $2,246 in the table. Devils Lake’s 376.26 mills produce $4,233.

The $1,987 a year between those two cities is about $166 a month of purchasing power. A buyer weighing Bismarck against Mandan, or Fargo against West Fargo, is comparing two tax bills as well as two towns, and no listing feed shows them the difference. Fargo alone contains three separate school-district mill levies, so a resident there cannot work out their own bill without help.

Assessment notices land, and two questions follow: whether the assessment is fair, and whether an appeal is worth filing. Both rest on one number, which is what the house is worth today. On ez Home Search that question shows up as a run of the automated valuation model (AVM), a visit to a home-value page, or a comparison of property taxes by state, county, city and ZIP code checked against the affordability calculator. The platform records that activity and surfaces it to the single partner who holds the county. Most agents have no way to see the moment a specific owner in their county checks. They find out months later, when the house lists.

The relief that followed gives a partner a reason to be in front of every homeowner in the county each January. House Bill 1176 passed the Senate unanimously and the House 86 to 4 on May 2, 2025. It raised the Primary Residence Credit from $500 to $1,600 a year, capped annual local property tax budget increases at 3%, and put an estimated $473 million of Legacy Fund earnings into relief for 2025 to 2027. The credit itself dates to 2023 and House Bill 1158. Homeowners reapply between January 1 and April 1 every year, with no age or income test and one credit per household. Uptake has run ahead of the budget, about $430 million projected against $408.9 million appropriated, because, as Tax Commissioner Brian Kroshus put it, $1,600 gets attention in a way $500 did not. That makes the January window reactivation material, a reason to reach an entire database with something worth opening. It generates no leads on its own.

Three more credits stack on top of it. A partner who knows all three is the informed one in the room. The Homestead Credit goes to owners 65 and older who pass an income test. The Disabled Veterans Credit is worth up to $8,100 in taxable value, with no income or asset restriction. The Homestead Credit for Special Assessments runs up to $6,000, is applied for every year, and creates a lien on the property payable to the state.

Property tax makes a North Dakota homeowner ask what the house is worth. Whoever sees that question asked owns the listing conversation before anyone else knows there is one.

Why connections through ez Home Search convert differently

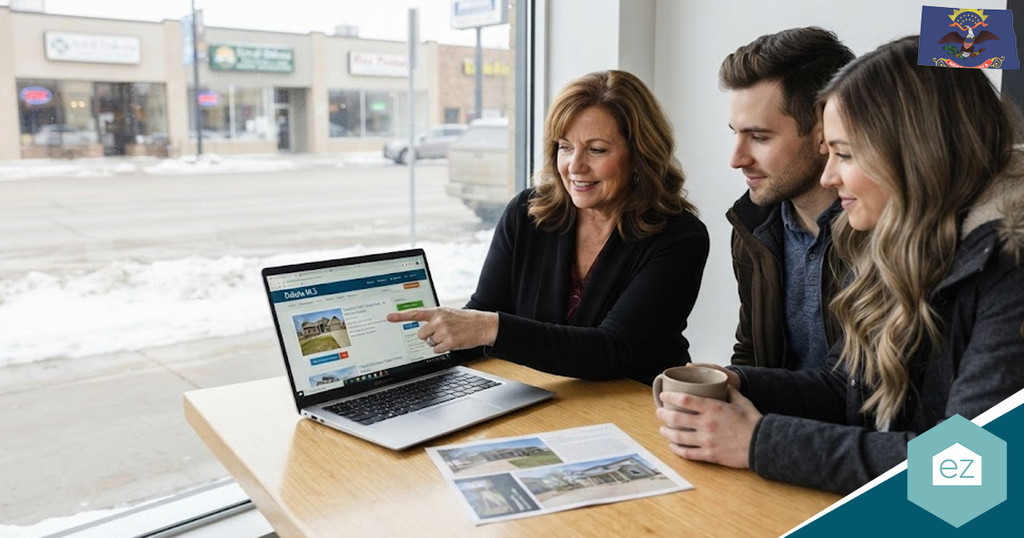
Three people sit at a table by a window, searching for North Dakota real estate leads on a laptop. Papers and a mug are scattered on the table, with snow falling outside.

Connections through ez Home Search convert differently because the person arrives already matched to one agent, on a platform they chose and stayed with while they made up their mind. That agent is the Single Local Expert: one vetted local partner who knows the county, picked for the fit with what the person needs rather than for outbidding everyone else to reach them. Nobody else was sold that name. Shared leads from legacy real estate portals run the other way, and an agent buying them competes for a name several other agents bought the same morning.

The promise underneath that match is The Only Confidential Home Search, and it is how ez Home Search delivers A Better Way To Discover Real Estate. Nobody sells, resells, recycles or broadcasts a person’s contact details and budget out to a crowd of businesses that person never chose. Their information does go somewhere. It reaches the one vetted county partner who serves them, and the person knows when it went and who received it. The person decides what else to share, and when.

In a North Dakota county of a few thousand people, an owner weighing a move has every reason not to raise a hand where it will be noticed. In a place that size, asking one agent a question is how the rest of the town finds out. One spouse often explores for months before saying anything to the other, and someone anticipating a divorce may plan six to twelve months ahead of telling anyone. Nobody researches the largest financial decision of their life on a platform that turns one search into a wave of calls.

A move runs through stages, and only the last one looks like a transaction. A person dreams, then gathers information about what homes cost and what their own home is worth. Then they plan the financing, the timing and the school-year calendar, and only then do they become active, first on one side of the move and then on the other. That path runs from a few days to several years, and most of it is private. ez Home Search is where the private part happens safely, which is why the partner behind that experience is the name already in place when the person is finally ready to act.

By the time the agent picks up the phone, they already know which neighborhoods the person kept returning to, the price range that came up over and over, which homes were saved and reopened, and the tour that finally got booked. Trust that normally takes weeks to build is half established before either of them speaks. The county exclusivity partners we work with tell us these connections typically convert inside 30 to 60 days.

Most lead sources reach a North Dakota homeowner only once that homeowner has raised a hand. The county partner has been there since the year before anyone knew a decision was coming.

What changes when one agent is the only ez Home Search partner in a North Dakota county

Man sits at a desk with a laptop, tablet, and charts on screens, discussing North Dakota real estate leads on the phone in a modern office with snowy scenery outside.

Under the Exclusive County Partnership, one agent, team or brokerage holds an entire North Dakota county, carries its own brand across the consumer experience there, and shares that territory with no other partner. The fee is one predictable number. Nothing is charged per lead and nothing comes out of the commission at closing, so a strong month in Ramsey County raises the partner’s income without raising the bill.

The largest return sits in the database the partner already owns. In a county the size of Nelson or Ramsey, a partner’s past clients and sphere are a meaningful share of every owner on the tax rolls. Between 88% and 92% of buyers report they would use the same agent again or recommend them, and only about 18% actually buy through one they have worked with before. Repeat clients and referrals make up roughly 41% of production across all agents and the majority of it for the most experienced. ez Home Search partners bring their own past clients back, through repeat business and through referral, 2.5 to 5 times as often as the market does.

Databases decay on their own: every year 15% to 22% of email addresses stop working and as many as one in ten people change their phone number. The co-branded search and the home value updates hold those details current, because the people keep using them and bring the new number along.

Some of those people leave. Census figures show about 2.1% of Americans moving to a different state each year and roughly another 3% moving to a different county within their own state, and North Dakota’s gross flows ran 27,348 people in and 21,106 out in 2024. A past client who takes a job in Minnesota still owns a house in Williams County, and that house is a listing somebody will win. ez Home Search covers every market in the country, so that client searches the new one on the partner’s own co-branded platform, and the search surfaces while the local listing is still in play.

The same co-branded surface makes the partner the county’s default name. The National Association of Realtors’ Profile of Home Buyers and Sellers reports that 81% of sellers speak to just one agent before choosing, that 77% of repeat buyers interview only one, and that reputation is the top factor for 35% of sellers. Most people never run a comparison, so the recognized name wins the client before anyone else gets a call.

The partner builds none of the conversion machinery and runs none of it. The valuations, the home value pages, the open house sign-in behind a QR code and the automated follow-up all run on the national ez Home Search platform, carrying the partner’s name. The co-branded content matters as much, because it gives a partner something worth sending every month without inventing it. January is the clearest case here, when a reminder that the Primary Residence Credit is worth up to $1,600 and closes on April 1 is a message a homeowner in Devils Lake opens. The City of Fargo Assessment Department reported remodeling exemption value up 156% in a single year while residential new construction exemption value fell 26%, and an owner who pulls a remodeling permit is an owner already thinking about what the house is worth.

ez Home Search puts people behind the platform as well, with weekly coaching sessions, Shut Up and Dial events and sales enablement playbooks. The county exclusivity partners we work with tell us the first thing that changes is the shape of the week, because the calls go to contacts whose own activity says they are close. The partner’s name sits on the search a homeowner in Grafton or Watford City opens on their own, months before that owner mentions a move to anyone.

Deciding whether an exclusive North Dakota county fits your business

A man stands on a suburban street with a smartphone and microphone, recording himself in front of a house with an American flag to discuss North Dakota real estate leads.

An exclusive North Dakota county fits a business that intends to still be the name people call five years from now. Most agents in the state answer the lead question a different way, by buying shared names off a legacy real estate portal, and that answer earns its keep. Those leads close, and agents in Fargo and Minot have built whole years of production on them. What the agent buys alongside them is a place in line. Three or four other agents received the same lead at the same moment, and in a market this size those agents are people you will see at the next board meeting in Bismarck or Grand Forks.

The opposite answer is to build the equivalent in-house: the search experience, the valuation modeling, the school and property tax depth, listing alerts that refresh by the minute, and a content engine that keeps a database warm every month. That bill runs into millions of dollars, and the data sourcing behind it sits out of reach for almost any single team or brokerage, let alone one working a state of roughly 800,000 people.

ez Home Search already runs all of it, and the Exclusive County Partnership puts one agent, team or brokerage on top of it in a single county. The partner’s brand sits on the search experience, the listing alerts, the home value updates and the local market reports that county’s buyers and sellers already use, with no competing partner inside the territory. The people in that county search listings, save homes and check what theirs is worth inside an experience carrying that brand, so a homeowner in Grafton or Beulah knows the business behind it long before they need an agent. It runs on one fee the partner can predict. Nothing is billed by the lead, and no cut of the commission changes hands at closing.

The trade is time. The first months go into moving a database onto the co-branded experience and getting in front of the county, and the reactivation and the recognition build from there. A position like that is slow to earn and slow to lose, and both halves of that are the point. An agent who needs three closings in the next thirty days should buy leads. An agent who intends to be the first call in that county in 2031 should claim it.

The largest return in a small market comes from the people who already know you. ez Home Search partners reactivate past clients, whether the next deal arrives as repeat business or as a referral, and the multiple runs 2.5 to 5 times what the rest of the market manages. Where your past clients and your sphere are a meaningful share of a county’s households, that multiple is worth more than a month of new contacts.

North Dakota has 53 counties, one partner holds each of them, and many are already claimed. The model works the same in Cass County as it does in Slope County. A recognized local name counts for as much in a town of 700 as it does in Fargo, and the smaller the county, the less it takes to become that name.

Someone will be the go-to real estate team in your county for the next decade, and every month a few more North Dakota counties answer that question. Check whether the county you already serve is still open.

Frequently asked questions

What gets a North Dakota agent in front of homeowners before the primary residence credit deadline each year?

Every North Dakota homeowner has to reapply for the primary residence credit between January 1 and April 1, with up to $1,600 at stake and no age or income test. That makes January the month to reach a whole database with something worth opening that is not a listing pitch. ez Home Search partners send it inside the co-branded home value updates and market reports their county already gets.

The reminder is reactivation, and by itself it produces nothing. The listing conversations come from the owners who read it and then go check what their own house is worth.

Where do listing leads come from in a county like Slope or Griggs, where a few homes change hands in a year?

They come from the owners getting close rather than the owners ready today. In a county with a few hundred owner households, the whole addressable market fits inside one database. The question narrows to which of those owners just ran a valuation, reopened a saved search, or went back to a home they saved last spring.

Predictive scoring has little to work with at that volume, because the model learns from closed sales. The co-branded ez Home Search experience those owners already use needs no such history. It reports what one named person did this week.

Why does the same house cost so much more to own in Devils Lake than in Williston?

Mill levies differ by taxing district, and North Dakota’s spread runs wide. The City of Fargo Assessment Department’s comparison of the twelve largest cities put the estimated 2024 tax on a $250,000 residence at $2,246 in Williston, a 0.90% effective rate, against $4,233 in Devils Lake at 1.69%. Both figures sit before the state’s primary residence credit.

That difference is about $166 a month on the same assessed value, which changes what a buyer can qualify for on the same income. ez Home Search lets a partner pull that comparison by county and city, which no listing feed does.

Is it price or property tax that sends Fargo buyers out to West Fargo, Horace and Casselton?

Price drives most of it, and the tax math pushes the same direction, out toward West Fargo, Casselton, Mapleton, Harwood and Horace. West Fargo’s effective residential rate of 1.30% sits below Fargo’s 1.34% on the same assessed value, so the carrying cost falls as well.

What agents miss is the timing: a household compares those towns on search and valuation tools months before it calls anyone. An ez Home Search partner holding Cass County watches that comparison happen, and the town a buyer keeps returning to says where to open the conversation.

What should a Minot agent be doing now to prepare for the Sentinel construction cycle?

Build the database and the recognized name now, ahead of 2027. Minot Air Force Base is preparing to host the LGM-35A Sentinel on a fiscal 2026 to fiscal 2040 timeline, with roughly $5 billion in planned construction and initial construction activity expected in 2027. That is a dated arrival of households into Ward County, visible years ahead.

Recognition takes time that a construction schedule will not hand back. The agent who holds Ward County through an ez Home Search Exclusive County Partnership spends the years before 2027 co-branded across the home search those households will open when they start looking.

How do agents in Ellendale, Harwood and other data center towns work demand that arrives before the housing?

Work it from the seller side first. More than 2,000 construction workers came into the Ellendale area, and the state funded 20 rental homes and a 38-unit apartment building there through its rural workforce housing program. Those builds show where the arrivals land first, and that is rental housing.

The owners already in town move sooner. New payroll and new neighbors change what a house in Ellendale or Harwood is worth, and owners answer that by looking the value up. An ez Home Search partner sees each of those valuations run, which opens the seller conversation months before any arrival buys.

How should a North Dakota agent handle the radon disclosure requirement from the 2025 session?

Disclose, and use the statewide form. NDCC section 47-10-02.2 requires a seller to disclose in writing any knowledge of radon concentrations before executing an agreement to sell or transfer residential real property, alongside the prescribed radon statement.

A seller or seller’s agent who complies is not liable for a claim based on the presence of radon gas or radon progeny in that property. On new construction or on vacant land intended for a home, hand over the form anyway.

An agent who raises the disclosure before a seller hears about it elsewhere is the informed party in the room, the standing an ez Home Search partner builds county-wide.

What lead sources work in a North Dakota county that is losing population while the state grows?

Population change and transaction opportunity measure different things. Of North Dakota’s 39 counties under 10,000 residents, 24 recorded a loss between 2024 and 2025, and the three larger counties that slipped did so by 100 people or fewer. None of that shrinks the owner base underneath.

Roughly four in five buyers nationally already own a home they will sell to buy the next, per NAR’s 2025 Profile of Home Buyers and Sellers. An owner in a slow-growth county still moves, inherits, downsizes and needs a valuation. The lead sources that work there read that activity one owner at a time, which is what an ez Home Search partner sees.

08.07.2026

How to Get More Real Estate Leads in West Virginia

West Virginia lost about 1.5% of its population between April 2020 and July 2025, according to Census Bureau estimates. Over the same stretch, house prices in the state rose about 47%, according to the Federal Housing Finance Agency. Both are true, and the gap between them explains why real estate leads in West Virginia behave nothing like the headlines about the state suggest.

More people moved into West Virginia than out of it in 2025. The population still fell, because deaths outpaced births. Census Vintage 2025 data analyzed by the West Virginia Center on Budget & Policy in May 2026 shows nearly 80,000 more deaths than births since 2011, while net domestic migration climbed from a 0.6% outflow in 2017 to a 0.4% inflow in 2025.

That difference decides how an agent spends the next year. Read the headline and West Virginia looks like a state to stop investing in. Look at what sits behind the number and you find roughly 545,800 owner-occupied households, most of them staying put, aging in place, and building equity in homes that will change hands eventually.

Most lead generation in this state chases the few people touring homes this weekend. The owner base is where the volume sits, and almost nobody is working it.

Deaths, births, and where West Virginia is growing

Aerial view of residential homes and streets in a West Virginia neighborhood
Roughly 545,800 West Virginia households own their home, and most of them are staying put.

West Virginia’s population change is a story about age, and for an agent it points toward listings rather than away from them. The West Virginia Center on Budget & Policy, working from Census Vintage 2025 estimates, found that deaths have exceeded births in the state every year for the past 15 years of available data, adding up to nearly 80,000 more deaths than births since 2011.

Migration ran the other direction. Net domestic migration moved from a 0.6% outflow in 2017 to a 0.4% inflow in 2025, and net international migration held near 0.1% a year, adding more than 16,000 residents since 2011.

The age profile is the part worth planning around. West Virginia’s median age is 42.9, fourth oldest in the country, and 22.5% of residents are 65 or older (US Census Bureau, 2025). Only two of the state’s 55 counties, Berkeley and Monongalia, recorded more births than deaths between 2020 and 2025. An owner base that skews this old generates moves on a schedule, and those moves are driven by equity, health, and family rather than by a school calendar.

Eight counties are gaining people

Twenty-six of the 55 counties recorded positive net migration since 2020, and eight grew in total population: Berkeley, Jefferson, Monongalia, Hampshire, Morgan, Monroe, Grant, and Hardy. Berkeley added 17,449 residents to reach 139,522, a 14.3% gain and the largest in the state by both measures. Kanawha, still the most populous county at 172,381, fell 4.6%. McDowell lost the most to migration, down 6.1%.

Both directions are business. A departure in the southern counties is a listing and a relocation referral. An arrival in the Eastern Panhandle is a buyer who will need a local expert within weeks.

The school numbers tell you who is moving and why

West Virginia public school enrollment stands at 234,957 students for 2025-26, down 2.5% in a single year and down 6.5% from 250,899 in 2021-22, according to the state Department of Education report presented to the Board of Education in November 2025. State Superintendent Michele Blatt noted that 53 of 55 districts lost students that year. Only Tyler and Doddridge counties grew.

Higher education moved the same way. The West Virginia University system counted 26,046 students in fall 2025, including 5,057 first-time freshmen, against 29,107 system-wide in fall 2020 (WVU Office of Data and Analytics).

One more shift changes what buyers ask you. About 19,000 West Virginia students now use the Hope Scholarship at a full award of $5,267.38, and beginning in 2026-27 eligibility opens to every student eligible to enroll in a public school (West Virginia State Treasurer’s Office). When funding travels with the child, a district boundary carries less weight in a buyer’s search than it used to, and the questions you field about a neighborhood change accordingly.

The ten most populous West Virginia counties and their principal cities

CountyPopulation (2025)Principal city
Kanawha172,381Charleston, the state capital and largest city
Berkeley139,522Martinsburg
Monongalia107,991Morgantown
Cabell91,183Huntington
Wood82,385Parkersburg
Raleigh71,775Beckley
Harrison64,221Clarksburg, with Bridgeport as the county’s second center
Jefferson63,102Charles Town, the county seat, with Ranson and Shepherdstown adjacent
Mercer57,503Princeton is the county seat; Bluefield is the largest city
Putnam56,885Winfield is the county seat; Hurricane is the largest city

County population estimates: US Census Bureau, July 1, 2025 (V2025).

Where the work, the money, and the broadband are going

The West Virginia State Capitol building in Charleston
Charleston, where the 2025 microgrid law and the 2026 homestead exemption amendment both originate.

Statewide employment is close to flat, and almost all of the movement sits in a handful of counties. Total nonfarm payroll employment rose by 1,900 jobs over the year to June 2026, and the single largest gain was private education and health services at 3,400 (WorkForce West Virginia and the Bureau of Labor Statistics, June 2026). WVU’s Bureau of Business and Economic Research projects state employment essentially flat through 2029, against a national rate near 0.5% a year. Health care is the one sector adding people consistently, which matters because health care workers buy houses near hospitals and clinics rather than near a single plant gate.

The capital projects are concentrated enough to name. Nucor is building a $2.7 billion sheet steel mill in Mason County that is expected to create more than 800 jobs, and the West Virginia Economic Development Authority approved $75 million for port and water treatment infrastructure at the site. Form Energy’s iron-air battery plant occupies the former Weirton Steel property in Hancock County, up in the Northern Panhandle. In April 2025 the Legislature passed HB 2014, the Power Generation and Consumption Act, creating a certified microgrid program for high-impact data centers, removing local jurisdiction over siting, and routing 60% of the resulting property tax revenue to state-controlled funds. Fidelis New Energy has announced a 2,300-acre compute campus in Mason County under that framework. Treat it as an announced pipeline, because that is what it is.

Broadband decides which counties can absorb a remote buyer

West Virginia was allocated $1.21 billion under the federal BEAD program and identified 110,220 unserved and underserved locations in its plan. The state’s final proposal was approved on November 21, 2025, and roughly $546 million went to eight subgrantees to reach more than 73,000 locations (West Virginia Office of Broadband; National Telecommunications and Information Administration).

Read those two numbers next to each other. The approved build covers about two thirds of the locations the state itself flagged, so connectivity stays uneven from county to county and, in the mountains, from hollow to hollow. An agent who knows which side of that line an address falls on can answer the first question a remote-working buyer asks, and most cannot.

What owning here costs

Median household income in West Virginia is $59,608, and 143,400 households, one in five, spend more than 30% of income on housing. Among homeowners specifically, 73,229 are cost-burdened (Housing Needs Assessment for the State of West Virginia 2025, prepared for the West Virginia Housing Development Fund by WVU Research Corporation).

Taxes cut the other way. The state’s effective property tax rate is among the lowest in the country, near 0.48%, according to ATTOM’s 2025 property tax analysis. The homestead exemption shields the first $20,000 of assessed value for owner-occupants who are 65 or older or permanently and totally disabled, after two years of state residency (West Virginia Code 11-6B-3). A constitutional amendment on the November 3, 2026 ballot proposes raising that exemption to $50,000. The transfer tax at closing is $1.10 per $500 of value or any fraction of it, collected by the county clerk in the county where the property sits at the moment the deed is recorded (West Virginia Code 11-22-2). For a database full of owners in their sixties and seventies, the exemption vote alone is a reason to call.

West Virginia has 55 counties, and a single real estate partner holds each one at a time. It takes a few minutes to learn whether the county you work is still open.

Your next listing is probably shopping as a buyer first

The National Association of Realtors puts first-time buyers at about one purchase in five nationally, near a record low in the association’s Profile of Home Buyers and Sellers. Turn that around: four purchases in five come from somebody who owns a house and has to unload it to fund the next one, which makes the buyer lead you paid for and the listing you wanted a single household. That share is a national one. No clean West Virginia series exists, and nobody should invent one.

Most agents work one side at a time anyway. They run “list with me” campaigns at sellers, they buy cold buyer names on the other side, and they bill the two halves of one move to two separate budgets. Be precise about what is happening: no single sale ever has the same human on both sides of it. The pattern is that the same household plays both roles across its own move, and it starts on the buy side, wondering what the money gets them before it ever wonders what the current house is worth. An agent who chases listings alone hands those four in five to whichever buyer’s agent picked up first, and that agent collects the listing a few months later.

A move runs through four stages, and three of them are invisible

People dream first. Then they gather information, checking what homes cost and what their own is worth. Then they plan, working through financing, payments, timing, and the school-year calendar. Only after that do they go active, usually on one side and then, because they are usually both, on the other.

That path can take a few days or several years, and it is frequently private. One spouse in a couple will often look at listings, or run the home value, for months before the subject comes up at the kitchen table. A person facing a divorce or a parent’s decline may work through the timing half a year or more before saying a word to anyone. Nobody announces the largest financial decision of their life while they are still deciding, and nobody makes it anywhere a single search turns into a week of phone calls.

What that looks like in West Virginia

The state has roughly 545,800 owner-occupied households and a homeownership rate of 74.9%, well above the national figure (US Census Bureau, 2020-2024 American Community Survey). About one in ten West Virginians moved in the past year. And 22.5% of residents are 65 or older.

Three groups sit inside that. First-time buyers are the smallest of them, and what they are short of is affordability, plain explanation, and nerve, not equity. The dual majority is working a different problem: the money locked in the house they are leaving, the calendar that has to line up on both sides, and one move that reads to them as a single decision rather than two transactions. Seller-only owners are the minority in every state, and here they skew older, an estate to settle, a move closer to family, a house built for a household that is not there anymore.

Serve whichever side is live. That requires knowing which side is live.

What changes when you cross a region line in West Virginia

The New River Gorge Bridge seen from a scenic overlook in southern West Virginia
New River Gorge National Park and Preserve drew 1.96 million recreation visits in 2025.

West Virginia is nine recognized regions, and the lead-generation job is a different job in each one. A playbook built in Martinsburg does not transfer to Beckley, and neither transfers to Parkersburg. The differences are big enough to change which lead source is worth paying for.

The Eastern Panhandle is a Washington and Baltimore commuter market that happens to be in West Virginia. Bright MLS put Jefferson County’s median sold price at $391,000 in August 2025, with closed sales up 12.7% year over year. Berkeley has added 17,449 residents since 2020. Buyers here compare a West Virginia address against Loudoun and Frederick county prices, and they win that comparison on cost and lose it on commute.

Mountaineer Country runs on the university and the hospital. Monongalia is one of only two West Virginia counties recording more births than deaths from 2020 to 2025, and Morgantown is an Ascend West Virginia community. The WVU system’s enrollment sits below where it was in 2020, which changes the rental math that has carried a lot of Morgantown investors for a decade. Harrison County, with Clarksburg and Bridgeport, anchors the region’s other half.

Metro Valley is where the state’s capital and its biggest industrial bet sit in the same region. Kanawha County’s population fell 4.6% since 2020, and the state’s housing needs assessment counts up to 6,906 dilapidated or abandoned units in or near Charleston. Downriver in Mason County, the Nucor mill and the announced compute campus are landing at once, which puts pressure on Point Pleasant and pushes buyers toward Putnam County and the Teays Valley corridor.

The Mid-Ohio Valley is the region with room. Wood County at 82,385 anchors it around Parkersburg and Vienna, and the state assessment flags high rental vacancy across several of its counties, meaning units are available rather than scarce. That is a buyer’s advantage worth naming out loud to a relocating family.

New River and Greenbrier Valley now runs partly on tourism. New River Gorge National Park and Preserve recorded 1.96 million recreation visits in 2025. Hotel occupancy tax collections in Fayetteville went from $108,639 in fiscal 2020 to $408,644 in fiscal 2025. In the planning region covering Fayette, Greenbrier, Nicholas, Pocahontas, and Webster counties, nearly 12% of housing units are held for seasonal or recreational use, so a meaningful share of the owners you would want to reach do not live there.

The Potomac Highlands are the state’s second growth story, and almost nobody covers them. Hampshire, Grant, and Hardy are three of the eight West Virginia counties that gained population since 2020. Bright MLS logged new pending sales up 47.1% in Hampshire and 83.3% in Hardy in August 2025, and those percentages come off very small bases, which is exactly why a single well-placed partner can own a county here.

Two more regions matter for coverage. In the Northern Panhandle, Form Energy’s plant sits on the old Weirton Steel site in Hancock County, and Wheeling anchors Ohio County at 40,496 residents. In the Hatfield-McCoy Mountains counties of Mingo, Wyoming, and Logan, trail tourism is adding short-term rental demand that the state assessment names directly as pressure on already tight local markets.

Six West Virginia regions and what is moving in each

RegionPrincipal countiesWhat is happening
Eastern PanhandleBerkeley, Jefferson, MorganFastest-growing region in the state. Berkeley up 14.3% since 2020; Jefferson closed sales up 12.7% year over year at a $391,000 median in August 2025. (Census V2025; Bright MLS)
Mountaineer CountryMonongalia, Harrison, Marion, PrestonOne of only two counties statewide with more births than deaths is Monongalia. Morgantown is an Ascend West Virginia community. (WV Center on Budget & Policy, 2026; Ascend WV)
Metro ValleyKanawha, Cabell, Putnam, MasonKanawha population down 4.6% since 2020, with up to 6,906 dilapidated or abandoned units in or near Charleston. Mason County is absorbing a $2.7 billion steel mill and an announced compute campus. (Census V2025; WVHDF 2025; WV Public Broadcasting)
Mid-Ohio ValleyWood, Jackson, Ritchie, RoaneWood County at 82,385 anchors the region around Parkersburg and Vienna. Rental vacancy runs high enough to indicate available units rather than scarcity. (Census V2025; WVHDF 2025)
New River and Greenbrier ValleyRaleigh, Fayette, Greenbrier, MercerNational park visitation of 1.96 million in 2025; Fayetteville occupancy tax collections nearly quadrupled from fiscal 2020 to fiscal 2025; roughly 12% of the planning region’s housing is seasonal. (National Park Service; 100 Days in Appalachia, 2025; WVHDF 2025)
Potomac HighlandsGrant, Hampshire, Hardy, Mineral, TuckerHampshire, Grant, and Hardy are among the eight counties gaining population. New pending sales up 47.1% in Hampshire and 83.3% in Hardy in August 2025, off small bases. (Census V2025; Bright MLS)

The Eastern Panhandle runs on a commuter rail schedule

Historic buildings in Harpers Ferry, West Virginia, surrounded by autumn foliage
Harpers Ferry is one of three West Virginia stops on the MARC Brunswick Line.

In Berkeley and Jefferson counties, a train timetable sets the buyer’s shortlist before the buyer ever calls an agent. West Virginia has three MARC stations, all on the Brunswick Line: Martinsburg, Duffields, and Harpers Ferry. The line runs nine commuter round trips a day out of Washington, and six of them reach Martinsburg (Maryland Transit Administration).

Those six trains are the whole story of who can live where. A household that needs to be at a desk in the District three days a week is choosing between a house within a reasonable drive of one of those three platforms and a house that requires 90 minutes on I-81 and I-270. That decision gets made before anyone opens a listing.

Ridership on the line fell from about 7,100 a day before the pandemic to 251 a day between April 2020 and March 2021, then recovered to roughly 2,400 a day by 2023, according to the MARC Brunswick Line Expansion Study. It has climbed again since. Maryland’s five-year MARC plan now targets peak-period service on the Brunswick Line at intervals of 60 minutes or less, which would put more trains on those same three West Virginia platforms. West Virginia riders have paid a surcharge since 2009, $2 on a one-way ticket and $80 on a monthly pass, according to the Maryland Transit Administration’s published fare schedule. It is a long-standing arrangement, and worth knowing before a client asks about it.

Every competing page about this market says the Eastern Panhandle is close to Washington. That sentence has never helped anyone pick a street. Tell them instead which three platforms exist, that Martinsburg sits at the far end of the line and takes two thirds of its daily trips, and that Maryland is planning to add frequency. That is information a buyer can act on. It also tells you which addresses to farm: Spring Mills and Falling Waters north of Martinsburg, Hedgesville to the west, Kearneysville and Middleway between the two counties, and the Charles Town and Ranson blocks within reach of the Duffields platform.

An agent who can hold that conversation is the local expert. An agent who says “you’re close to DC” is a search result.

Remote work did not go away, and West Virginia’s smaller counties are where it lands

A white farmhouse beside a winding rural road in West Virginia in fall
West Virginia’s work-from-home share more than doubled between 2019 and 2024.

West Virginia’s work-from-home share more than doubled between 2019 and 2024, from 3.92% of workers to 8.81%, and it is still sitting at better than twice where it started (US Census Bureau, American Community Survey 1-year estimates, table B08006). The national share moved the same way over the same years, from 5.7% to 13.3%.

Every headline says the opposite. The Federal Reserve Bank of Minneapolis examined Current Population Survey microdata in June 2026. It found that nearly 22% of US workers aged 16 and older worked from home at least some of the time in 2025, down just under one percentage point from 2024. The Fed’s own word for that was “sticky.” The 2025 declines sat in two sectors with identifiable causes: public administration fell about six percentage points and the information sector about five, both following return-to-office mandates. Professional services and health care grew their share of the remote workforce over the same period. Health care is also the sector this state has been adding jobs in.

The USDA Economic Research Service has been tracking what this does to rural counties nationally, and the pattern should look familiar. Rural counties have run negative natural change for eight consecutive years and have grown anyway every year since 2020, because arrivals more than offset the gap. They added roughly 168,000 residents in 2025, the fifth straight year that held. Between 2020 and 2024, 65% of nonmetro counties recorded positive net migration.

That is West Virginia’s own arithmetic, written at national scale. What is happening here is the rural pattern the USDA has been tracking for a decade, playing out inside one state’s borders.

Which places absorb that demand here is a broadband question before it is a housing question. Some 86.1% of West Virginia households had a broadband subscription in the 2020-2024 American Community Survey, and the state’s approved BEAD build reaches about two thirds of the locations it flagged as unserved or underserved. The counties positioned to take the shift are the ones where those two things line up: Hampshire, Hardy, Grant, and Tucker in the Potomac Highlands; the Greenbrier Valley around Lewisburg and White Sulphur Springs; Fayette and Nicholas in the New River corridor; Randolph around Elkins. Ascend West Virginia has already brought more than 900 new residents into six communities across the state, among them Morgantown, Greater Elkins, the New River Gorge, the Greenbrier Valley, the Eastern Panhandle, and, since September 2025, the Charleston area. Retention runs above 96%, average individual income above $97,000, and each participant arrives with an average of 1.9 additional people.

Remote buyers ask for specific things: a room with a door that shuts, or an accessory dwelling unit or outbuilding to work from; square footage a five-day commuter never needed; a connection that holds through a February video call. Most agents in these counties are not fielding those questions yet, which is the whole opportunity.

Beyond the metros, ten counties worth working

Rolling farmland, barns, and a church steeple near Lewisburg, West Virginia
Greenbrier County runs on Lewisburg and White Sulphur Springs.

Most of West Virginia’s 55 counties sit outside a metro area, and being the name people think of first pays as well in a county of 12,000 as it does in a county of 170,000. That same National Association of Realtors research found 81% of sellers speak to a single agent and no one else before signing, 77% of repeat buyers sit down with just one, and 35% weigh reputation above every other factor in the choice. In a small county that math is brutal and it is also a gift, because there is room for one name and it can be yours.

Greenbrier County runs on Lewisburg and White Sulphur Springs, with Ronceverte and Rainelle behind them, and it has a steady flow of buyers arriving from Virginia and the Carolinas. Pocahontas County around Marlinton and Snowshoe, and Tucker County around Davis, Thomas, and Canaan Valley, have been the state’s established mountain markets for decades. A large share of the owners in both counties live somewhere else, which changes everything about how you reach them: they are not driving past your sign, and they check on their property from a laptop in another state.

Morgan County at Berkeley Springs and Hampshire County at Romney are the growth counties nobody writes about, and both gained population since 2020. Preston County around Kingwood and Terra Alta feeds Morgantown commuters without Morgantown prices. Nicholas County at Summersville sits between the New River corridor and the interstate. Jackson County, at Ripley and Ravenswood, is close enough to the Mason County buildout to feel it in rents before it feels it in prices. Randolph County around Elkins is an Ascend West Virginia community, which means new arrivals with above-average incomes and no local relationships yet.

Ten West Virginia counties beyond the big metros

CountyCommunities
GreenbrierLewisburg, White Sulphur Springs, Ronceverte, Rainelle
PocahontasMarlinton, Snowshoe, Hillsboro, Durbin
TuckerDavis, Thomas, Parsons, Canaan Valley
MorganBerkeley Springs, Great Cacapon, Paw Paw
HampshireRomney, Augusta, Capon Bridge, Slanesville
HardyMoorefield, Wardensville, Baker, Mathias
PrestonKingwood, Terra Alta, Bruceton Mills, Reedsville
NicholasSummersville, Richwood, Craigsville, Mount Nebo
JacksonRipley, Ravenswood, Sandyville, Cottageville
RandolphElkins, Beverly, Harman, Mill Creek

Nearly 12% of the housing in the planning region covering Fayette, Greenbrier, Nicholas, Pocahontas, and Webster counties is held for seasonal or recreational use, according to the 2025 statewide housing needs assessment. A postcard does not reach an owner who lives four states away.

If you work one of these counties and want to know whether it is still available, ask before your competitor down the road does.

What West Virginia agents do now, and where each approach runs out

A real estate agent shakes hands with a couple in front of a house for sale, representing successful West Virginia real estate leads.

Every approach below works, which is why agents keep paying for them. Each one also has a ceiling, and in West Virginia the ceilings arrive sooner than they do in a high-price metro. They are worth walking honestly before anything else gets said.

Shared leads from legacy portals produce volume, and they produce closings. The structure is what limits them. One name lands in several inboxes at the same moment, so the opening call is a sprint instead of an introduction, and the agent pays for that sprint either per name or out of the commission. In a market where a good month is a handful of transactions, paying twice over for a name three other people also bought is a hard way to build a year.

Your own IDX website is a genuine asset and it should exist. It is also a slow one. It ranks for a narrow band of queries against national platforms with engineering teams, it goes stale the week you stop feeding it, and the people who find it are mostly people who already know your name. It answers “where do I send my sphere” well. It does not answer “how do I reach the hundreds of thousands of owner households in this state who have never heard of me.”

Cold calling and dialers are still the fastest way to a conversation, and still legal. What most agents miss is that federal law puts them in the telemarketer category the second they prospect by phone or text, whether the target is a for-sale-by-owner sign, an expired listing, or a circle-prospecting list around a home that just closed. Should the person on the other end deny ever agreeing to hear from them, proving otherwise falls on the agent, number by number. A call or text with no proof behind it runs $500, a willful violation runs as high as $1,500, and nothing puts a ceiling on the total. Lawsuits of this kind more than doubled in 2025, and most arrive as class actions. Do Not Call complaints reached the Federal Trade Commission at a rate above 2.6 million in fiscal year 2025 alone. Run the numbers on a 10-agent team: one campaign, 3,000 dialer calls, documented consent on only a third of them, and the exposure starts near $1 million.

Predictive seller software scores a database, surfaces the names most likely to move, and points an agent in a useful direction. What a score cannot do is hold a relationship. Someone still has to build that relationship and keep it warm until a guess turns into a listing appointment, and no model does that part.

All-in-one CRMs and stitched-together stacks both ask for your time before they give any back. Buy the all-in-one and you spend months configuring it. Assemble the stack and you spend every week keeping it alive. Either way the data and engineering behind accurate valuations and a national search experience stay out of reach, because that is not what a CRM is for.

Do-it-yourself content and paid advertising work while you are running them. Both stop the day you stop, and neither leaves behind something a past client will come back to unprompted half a year later.

Three things that make every ceiling lower here

Severed mineral rights sit under a large share of West Virginia property, often separated from the surface generations ago and in some cases by conveyances written in the 1800s, and split since then across many heirs. Out-of-state buyers stall on it constantly, and a clean answer can require a mineral attorney. That is time between lead and closing that does not exist in most states.

The housing stock is old and a lot of it needs work. Some 44% of West Virginia households live in homes built before 1980, and the state’s 2025 housing needs assessment counts 23,947 vacant units sitting empty specifically because they need repair or are being repaired. The pre-listing conversation about what to fix and what to skip is a bigger part of the job here, and it starts months before anyone signs a listing agreement.

Then there is the driving. Topography, land ownership patterns, and water and sewer limits stretch a rural county’s service radius, and windshield time is a real, uncompensated cost of working a lead that may or may not be ready.

The arithmetic nobody puts on a slide

The median value of an owner-occupied home in West Virginia is $162,600, and median household income is $59,608 (US Census Bureau, 2020-2024 American Community Survey). Run that against a $600,000 market and the same lead, at the same price, has to work roughly four times harder here to pay for itself.

That is the whole reason lead generation feels like it stalls in this state even when the agent is doing everything right. The activity is fine. The unit economics are not, and no amount of dialing fixes a model that charges per lead or takes a slice of a commission that was smaller to begin with.

What an Exclusive County Partnership gives a West Virginia agent

A woman smiling while talking on her smartphone at a desk with a laptop, managing her West Virginia real estate leads.

The Exclusive County Partnership answers that arithmetic head on. Whoever holds a West Virginia county under it holds the whole thing, alone, and the holder can be one agent, a team, or an entire brokerage. Every opportunity inside the county line goes to that partner, nothing is billed per name, and closing a deal costs no piece of the commission. The fee is predictable and it does not move. A strong month stays a strong month instead of arriving as a larger bill. Where the median owner-occupied home is worth $162,600, that structure carries more weight than it would almost anywhere else.

What arrives is different too. A person who reaches an ez Home Search partner is not a name that was sold to four agents at once. They come attached to a record the agent can read: which style of house they kept opening, which streets they came back to, where their price kept settling, and which home finally made them ask for a tour. That lets the opening conversation start on the person’s own terms, and most of the trust that normally takes weeks is already there before either of them speaks. Across ez Home Search partners, opportunities worked this way convert inside 30 to 60 days instead of grinding through a year of follow-up.

Why people engage in the first place

The product underneath all of it is The Only Confidential Home Search, and that pillar is how ez Home Search keeps the brand promise it prints on everything: A Better Way To Discover Real Estate. Nobody’s phone number, email, or budget gets sold, resold, recycled, or pushed out to a roster of businesses they never picked. Each person is matched with one vetted local expert, the Single Local Expert, and the remainder of the vetted network stays available to them only on their own say-so.

Go back to the four stages. A West Virginia homeowner in her late sixties, deciding whether the house still fits the years ahead, is going to spend months gathering before she plans and longer before she goes active. She will not do that on a platform that turns one home-value lookup into a week of calls from strangers. She will do it somewhere private, and the partner whose brand is on that experience is the name she already trusts when she is finally ready. With 22.5% of the state’s residents 65 or older, that scenario describes most of the West Virginia pipeline.

The database the partner already owns

The largest opportunity is usually not new business at all. About 41% of what the average agent closes traces back to a past client or to somebody a past client sent, and the veterans of the business run well above that. Somewhere between 88% and 92% of buyers will tell you they would happily use their agent again or send a friend, while roughly 18% actually do. Everything in that gap was earned once and then lost.

ez Home Search closes it for the partner. Past clients keep coming back to the co-branded search to watch their value and follow their own market, and ezNurture fires the outreach off what they do there instead of off a calendar. When an ez Home Search partner works that database, repeat business and referrals come back at roughly 2.5 to 5 times the market rate.

Nationwide coverage also protects the listing when a client moves away. Each year, Census figures put roughly 2.1% of Americans in a different state and about another 3% in a different county inside the state they already live in. For an agent in McDowell or Mingo County, where residents have been leaving faster than anywhere else in West Virginia, that is the difference between hearing about a move in time to win the listing and hearing about it after the sign goes up.

The compliance problem, handled before you dial

By the time an opportunity reaches the partner, ezVerify.ai has already confirmed the opt-in, banked the audio that documents it, checked the number against a known-litigator database, and cleared every number that appears on the Do Not Call registry. Contact detail the agent would have spent an afternoon chasing arrives filled in. It is consent proof and enrichment, never a lead score, and it lifts the job’s biggest liability off the partner’s desk on everything ez Home Search sends.

One partner per county, and West Virginia has 55

A small West Virginia main street with storefronts and houses
In a county of 5,000, one name owns real estate the same way it does in a county of 170,000.

A county is spoken for by exactly one partner, and no competitor can buy that position at any price. That is the part of this that cannot be copied. Many of West Virginia’s counties are already claimed and more are taken every month, so the only useful question is whether a specific one is still open.

The position itself is what compounds. A partner’s name and brand sit across nearly the entire consumer experience in their county: their search, their listing alerts, their home value emails, their local market reports. Every one of those touchpoints builds the partner’s brand rather than a portal’s. An agent or team carries that brand into any brokerage they ever join, and an owner who holds the brokerage builds equity in the company itself. Local buyers and sellers start associating one name with real estate in the county long before anyone picks up a phone.

Nothing has to be built. Millions of people are already on the national platform, the partner’s brand goes onto it, and the whole arrangement runs from the first day. There is nothing to configure, no stack to hold together, and no engineers to hire. A year spent administering software is a year not spent in front of clients, and that trade is the one most agents make without noticing.

The model does not change with county size. It works the same in Kanawha and Berkeley as it does in Pocahontas or Wirt, because one trusted name carries the same weight in a county of 5,000 that it carries in a county of 170,000, and it is far easier to become that name in the smaller one. West Virginia is a state built out of small counties. That is a disadvantage under a per-lead model and an advantage under this one.

What this comes down to for a West Virginia agent

A man in a blazer and an older woman sit at a cafe table, reviewing West Virginia real estate leads on a tablet together.

Three paths are open, and most agents take the first one by default. That path is the status quo: keep buying shared names, keep feeding the site you built, and keep running that against a $162,600 median. It produces closings. It does not compound, and the arithmetic gets harder every year the fee schedule outpaces the commission.

At the far end sits building the whole thing yourself. That means a national search experience people return to on their own, valuation modeling accurate enough to open a seller conversation, school and property tax data at the county and district level, consent infrastructure that survives a TCPA complaint, and automated follow-up that fires on behavior rather than a calendar. It is genuinely possible. It costs millions of dollars and several years, and the data sourcing underneath it sits beyond what a West Virginia brokerage can buy at any size.

The Exclusive County Partnership sits between them. It gives you a flat fee, a county to yourself, nothing billed per name, no slice of the commission, and a platform that was built and running long before you signed anything.

Be clear about what it costs you. Exclusivity runs both directions: the county is committed to one partner, so this works only if you are prepared to serve all of it rather than the corner you know best. And the business it produces builds rather than spikes. The relationships that make this model pay compound over months, so an agent looking for a full pipeline next Tuesday should keep dialing instead.

An ez Home Search partner reactivates past clients, through repeat purchases or referrals, reaching 2.5 to 5 times the market rate. It is revenue they already earned once and would otherwise have lost, and it is the number to weigh this decision against.

West Virginia’s population is falling because more people are dying than being born, while more people move in than move out. That is a demographic fact, and read correctly it describes a listing pipeline: an owner base of roughly 545,800 households, a fifth of the state past 65, and homes that will change hands on a schedule almost nobody is working. Whoever is the trusted name in a county when those owners are ready will handle those moves. The state has 55 counties, and one partner holds each.

Two minutes will tell you whether yours has been taken.

Frequently asked questions

Why is West Virginia’s population falling while home prices keep rising?

The two numbers measure different things. Population change here is driven by deaths outpacing births, nearly 80,000 more of them than births since 2011, while net domestic migration turned positive in 2025. Prices respond to how many households want a home against how many homes are available, and on that measure the state has held steady, with house prices up about 47% over five years according to the Federal Housing Finance Agency.

For an agent, the practical reading is that the number of potential clients is not collapsing. The age of those clients is shifting, which changes what they need from you and when they will need it.

How do I compete for Eastern Panhandle buyers who commute to the Washington and Baltimore metros?

Know the rail. West Virginia has three MARC stations on the Brunswick Line, at Martinsburg, Duffields, and Harpers Ferry, and six of the line’s nine daily commuter round trips out of Washington run to Martinsburg. That schedule decides which Berkeley and Jefferson addresses a commuting household will consider before they ever contact an agent.

You win the relationship by being the person who can explain that, and by being in front of the buyer while they are still comparing a West Virginia price against a Loudoun County one. The hard part is reaching them at that stage, which is exactly what a co-branded national search experience is for.

Where do listing opportunities come from in Kanawha County now that Charleston has been losing residents?

They come from the owners who stayed, which is most of them. Kanawha remains the state’s most populous county at 172,381 residents. A 4.6% population decline over five years still leaves tens of thousands of owner households in Charleston, South Charleston, St. Albans, Nitro, and Cross Lanes, many of them older owners with substantial equity and a decision ahead about whether the house still fits.

Those decisions surface as behavior long before they surface as a listing appointment: a home value checked twice in a month, a dormant search resumed, an old favorite reopened. An agent who can see that activity calls at the right moment instead of working a list in alphabetical order.

How do severed mineral rights change the way I work a rural West Virginia listing lead?

They lengthen everything, so you have to start earlier. Mineral ownership across much of the state was separated from surface ownership generations ago, sometimes by deeds written in the 1800s, and it may now be split among many heirs. An out-of-state buyer usually has never encountered the concept, and answering the question cleanly can require a mineral attorney.

Treat it as a reason to be in the relationship months ahead of the transaction rather than as a deal-killer. A seller who has already worked through their title questions with you is not going to interview anyone else.

With 44% of West Virginia homes built before 1980, how do I handle a seller lead whose house needs work before it lists?

Start with the value question, not the repair list. An accurate automated valuation model, or AVM, gives the owner a real number to reason from, and from there the conversation about which repairs move the price and which are wasted money becomes concrete instead of anxious.

That conversation also takes time, which is why it belongs months before a listing agreement. The state’s 2025 housing needs assessment counts 23,947 vacant units sitting empty specifically because they need repair. Every one of those was once an owner who did not get that guidance early enough.

Are Ascend West Virginia arrivals worth building a pipeline around in Morgantown, Elkins, and the Greenbrier Valley?

They are, with realistic expectations. The program has brought more than 900 new residents to the state at a retention rate above 96%, with average individual income above $97,000 and an average of 1.9 additional people arriving with each participant. That is a few hundred households across six communities, not a wave.

What makes them worth the attention is that they arrive with money, no local relationships, and a high likelihood of buying within a year or two of renting. The entire job is to be the recognized name in that county when they start looking.

08.06.2026

New York Real Estate Leads: Reach Owners Before They List

New York has the lowest homeownership rate in the country, about 54%. It also has 35 counties, out of 62, where more than 70% of households own their home. Both numbers are correct.

The gap between them is where most New York real estate leads come from. Four counties produce that statewide figure: Queens, Brooklyn, Manhattan, and the Bronx. Everywhere else the owner base is deep, stable, and almost entirely out of the market on any given day. Homeowners now hold a median of 11 years before they sell, a record according to the National Association of Realtors. That is a long time to be invisible.

An owner who bought eleven years ago is not looking for an agent this week. They are watching their value and wondering what their taxes are doing. They have told no one. By the time they call somebody, the decision is mostly made.

What follows is where New York’s owner base sits, what moves it, and how a team reaches them in the years before anyone raises a hand.

New York’s owner base is bigger and more concentrated than the headline number says

New York has the lowest homeownership rate of the fifty states, roughly 54% against 65.8% nationally, and that figure is the most misleading number a New York team can plan against. It describes a state almost nobody works in.

Multi-story brick apartment buildings in New York City, the housing stock behind the state's low homeownership rate
Buildings of ten or more units make up 90% of Manhattan’s housing stock. A borough of rental towers reports a low ownership rate because it is a borough of rental towers.

Four counties produce it. As of 2020, homeownership ran 45% in Queens, 30% in Brooklyn, 24% in Manhattan, and 20% in the Bronx, according to the New York State Comptroller’s analysis of Census data. Housing stock explains the whole thing. Buildings with ten or more units make up 90% of Manhattan’s housing, 68% of the Bronx’s, 42% of Brooklyn’s, and 36% of Queens’s. A borough of rental towers reports a low ownership rate because it is a borough of rental towers.

The comparison across states lands the same point. Only two others sat below 60% in 2021, California at 55.9% and Nevada at 59.1%, and both share New York’s heavy multi-unit stock. In nearly all thirteen states above 70%, single-family homes make up more than 70% of the housing. Ownership rates track building types closely.

Now take those four counties out. Every remaining county in the state sits above the statewide average, and 35 of New York’s 62 counties are above 70% homeownership. Single-unit homes are the majority of the stock everywhere outside those four. That is the New York a team upstate, on Long Island, or in the Hudson Valley is standing in, and it looks nothing like the headline. New York’s own rate has been climbing, from a low of 50.2% in mid-2018 to 53.6% by mid-2022.

The planning error is easy to make and expensive to hold. A broker who reads “lowest homeownership rate in the country” and concludes the owner base is thin has described Manhattan and applied it to Oneida County. The reverse is closer to true. New York held about 20.0 million residents on July 1, 2025, per Census Vintage 2025 estimates published by the Cornell Program on Applied Demographics, and the large majority of owner-occupied homes sit in counties where seven in ten households or better own the roof over their heads.

So the pool is deep. It is also slow.

Homeowners nationally now hold a median of 11 years before selling, a record, according to National Association of Realtors data carried in the New York State Association of REALTORS® 2025 annual report. Put that tenure against an owner base this large and the arithmetic gives a steady, predictable flow of sellers arriving out of a very deep pool, spread across sixty-two counties, most of them years from a decision on any given day. The pool stays large. The wait between listings gets longer.

That is the shape of the opportunity, and it is also the problem. The owners who will list next year are sitting in those counties right now, in homes they bought around 2015. None of them look like a lead today. They are not on a list, they have not filled out a form, and they will not respond warmly to an agent who turns up in the last three weeks of an eleven-year hold. For a team building a pipeline in this state, that is the whole problem worth solving: finding those owners early, and staying in front of them through the years in between.

What New York’s statewide sales numbers say

New York home sales have been flat for three years, and flat is the national condition rather than a New York one.

Here is the ten-year record, compiled by the New York State Association of REALTORS® from the state’s multiple listing services. Closed sales ran 129,833 in 2016, 133,676 in 2017, 130,914 in 2018, 130,802 in 2019, and 129,661 in 2020, a five-year band about three percent wide. 2021 spiked to 149,690. 2022 came back to 132,661. Then 2023 stepped down to 106,474, and the level held: 105,340 in 2024, and 105,279 in 2025. The ten-year average sits near 125,400.

The 2023 step down was real and it has not reversed. It was also not a New York event. National existing-home sales, per the National Association of Realtors, ran 4.10 million in 2023, 4.06 million in 2024, and 4.06 million in 2025, a two-year move of about one percent. New York’s equivalent move over the same three years was 1.1 percent. Two flat lines, one national and one statewide, track each other almost exactly.

If someone has told you this market is dying, that is the number to hand them. Three years at the same level describes stability.

Prices ran the other direction throughout. The statewide median sale price was $234,000 in 2016 and $430,000 in 2025, and it reached a record $475,000 in June 2026. Inventory has now risen year over year for sixteen consecutive months, reaching 32,508 homes on the market in June 2026, and pending sales that month were up 8.1 percent.

Those last two figures measure different things and get conflated constantly. Inventory counts homes sitting on the market at a moment in time. Closed sales count deals finished across a period. Inventory climbing means supply is rebuilding from a low base, 23,405 homes at the end of 2025 against 58,544 back in 2016, which is a separate statement from anything about how many New Yorkers are buying.

For a team planning the next two years, the read is unglamorous and useful. Sales volume is steady, supply is improving, and prices are at records. Nothing in the statewide data argues against building a pipeline in this state. The figure that should shape the plan sits somewhere else entirely: the eleven years an owner holds before they call anyone.

Most New York owners are years from listing, and they plan in private

At any given moment, no more than 5% to 10% of people are actively buying or selling a home. Set that against the 105,279 sales New York closed in 2025 and the proportion gets concrete. A small, visible band of transactions sits on top of an owner base spread across sixty-two counties, and the great majority of that base never surfaces in a given year.

Aerial view of an upstate New York suburban neighborhood in autumn, where most of the state's owner base sits
The owners who will list in 2029 are sitting in these houses right now, years into a hold that no one else can see.

Homeownership moves through stages, and only the last one looks like a transaction. A person dreams. Then they gather information, what homes cost in the places they are weighing and what their own place is worth. Then they plan, which means financing, payments, the logistics of a move, and often the school calendar. Only then do they become active, first on one side of the move and then, because most people are both, on the other. That path runs anywhere from a few days to several years.

The part that decides who wins the listing is that most of it happens in private.

In a couple, one spouse frequently explores a move, or runs a valuation on the house, for months before raising it with the other. Someone anticipating a major life change may plan six to twelve months ahead of saying anything to anyone. These are not people being coy. They are working through the largest financial decision of their lives and they would like to think about it before a stranger starts calling. That is precisely why they will not do that thinking anywhere a single search turns into a wave of calls.

Put that against New York specifically. The owner base sits in the thirty-five counties above 70% homeownership. The median hold is eleven years. Somewhere around year eight or nine, a homeowner in Oneida or Ontario or Dutchess County starts checking what their place is worth, and tells nobody.

Every lead source built to surface people who have already raised a hand is competing for the last few weeks of that process. By the time a form gets filled in, the owner has been thinking for a year or more and has usually formed an impression of who they will call. The agent who arrives at the form is arriving late to a decision that got made somewhere else.

The teams that win those listings were already present through the years in between. That is a different discipline from prospecting, and it is the one this state rewards.

The buyer you are not working is the seller you want

Most New York teams run two separate campaigns. One markets “list with me” to homeowners. The other buys buyer leads, usually cold and usually shared with several other agents. Two budgets, two message sets, and two lists all aim at what the team treats as two different populations.

They are mostly the same people.

First-time buyers accounted for 21% of all home purchases by the middle of 2025, according to National Association of Realtors data carried in the New York State Association of REALTORS® annual report. That leaves about four in five purchasers holding a house they plan to sell so they can buy the next one. The same report puts the typical first-time buyer at a record age of 40, and the median age of all buyers at 59.

Be precise about what that means. On any single house, the buyer and the seller are different people. The point is that across a move, one person is usually both, and they almost always start on the buy side. An owner weighing a sale begins by finding out what their equity buys somewhere else. They shop first and list second. A team chasing listings alone hands four in five of those people to whichever agent met them while they were still shopping, and that agent collects the listing later as a matter of course.

Three groups sit inside that, and they need different things.

The one in five buying a first home have no equity to work with. They need affordability, plain explanation, and enough confidence to act. The four in five who are both need something harder: a credible number on the house they are leaving behind, a sequence that keeps them from carrying two mortgages or none, and both sides of the move run as a single transaction. Seller-only situations are the minority, and they look like an estate settling, a landlord cashing out, or a parent moving in with adult children.

Most agents pick a lane and stay in it. The advantage available in New York comes from reading behavior instead, and serving whichever side is live at the moment. A valuation checked, an equity question asked, a home-value page opened twice in a week: those say the listing discussion has started. A search picked back up, an alert opened the morning it arrives, a showing booked: those say the purchase is live. Most people generate both sets, in order, buying first and listing a year or two behind it.

That is what the two-campaign split costs in a state with an eleven-year median hold. The buyer lead a team writes off as unqualified in March is frequently the listing that closes with somebody else in the spring after next.

What moves a New York owner to sell

Four things move a New York owner: equity, a life event, timing, and taxes. The last one carries more weight in this state than in most, and it is the one an agent can see coming.

New York carries one of the heaviest residential property tax loads in the country. Three of the six US counties where the median property tax bill runs above $10,000 are Nassau, Rockland, and Westchester, according to the Tax Foundation’s county property tax data. Half the counties in America at that level sit in one state.

The mechanism matters more than the number. A recurring annual cost comes out of the sale price rather than getting added to it. A buyer prices a home on what it costs to hold, not on the sticker, and the house delivers the same shelter either way, so the tax gets absorbed into what someone is willing to pay. A tax bill that climbs over a decade holds down what a home can eventually sell for. Almost no owner works that out on their own. They see the bill go up and they file it under annoyance, not under equity.

The New York City second-home surcharge that took effect in July 2026

New York City added a new one in 2026, and it is the sharpest example of everything above.

As part of New York State’s fiscal 2026-2027 budget, enacted in May 2026, the city now imposes an annual surcharge on residential property that does not serve as a primary residence. It took effect July 1, 2026 and runs until June 30, 2031, and it carries a retroactive edge, because it reaches obligations back to January 1, 2026. It applies to one-to-three-family homes, townhouses, condominiums, and cooperatives, and the Department of Finance makes an annual determination of whether a property is somebody’s primary residence. A trust, an LLC, or a partnership does not sidestep it, because the rules look through to the individual behind the entity.

Table shows New York real estate leads property type, value ranges, and annual surcharge rates for homes and condos from July 2026 to June 2028. Rates range from 0.80% to 6.50%.

Read those two blocks together rather than separately. The co-op and condo percentages look punitive because they apply to the Department of Finance’s existing comparable-rental valuation, which runs substantially below what those units sell for. Quote 6.5% against a sales price and you badly overstate the bill. From July 1, 2028 condos and co-ops get revalued on comparable sales and everything converges on the $5 million threshold and the lower rates. Sullivan & Cromwell and Holland & Knight both flagged the valuation gap in their 2026 client alerts: do not read those percentages against a sales price.

The calendar matters as much as the rate. The Department of Finance must notify every covered owner by August 30, 2026, and an owner who misses the department’s response deadline loses the right to contest non-primary status for that year. Estimates of the scope run from roughly 10,000 properties to the 14,000 Holland & Knight cited in its June 2026 alert.

Now run the arithmetic on a Class 1 property, because those already use market value. A $6 million townhouse held as a second home carries $48,000 a year on top of existing taxes. Discounted at 5% across the five years to the 2031 sunset, that stream is worth roughly $208,000, about 3.5% of the value. If buyers instead assume the surcharge gets extended and price it as permanent, the same stream capitalizes to roughly $960,000, about 16%. Those are illustrative figures on stated assumptions rather than a valuation of anyone’s home, and none of this is tax advice. The point is the spread. Whether the surcharge expires or renews is worth about three quarters of a million dollars on one property, and nobody can tell an owner which way to price it without doing the work.

The other three, sized for New York

Equity is the one owners misjudge most. An owner who bought in 2015 and held the median eleven years is sitting on a different number than they think, and county medians in 2025 ran from $153,000 in St. Lawrence to $805,000 in Nassau. The gap between what someone assumes and what the data says is the whole conversation.

Life events arrive on their own schedule. Timing is harder in New York than most places, because selling one home and buying another without carrying two mortgages or none is a genuine problem in counties running 0.5 to 1.2 months of supply. And relocation moves a steady share of owners every year, which the next section takes up.

Every one of these is a question whose answer is a number. An automated valuation model, or AVM, paired with property-tax detail at the state, county, city, and ZIP level is what lets a partner answer that question before the owner has thought to ask anyone else.

Where New York’s owner base is deepest

New York’s ten largest counties by population are not its ten deepest markets for owner-occupied homes, and the reason is the one from earlier: four of the top six are the four counties with the lowest ownership rates in the state.

Two homeowners on the front porch of a light blue two-story New York home surrounded by autumn trees
New York homeowners now hold a median of eleven years before they sell. Most of that time, nobody knows a decision is coming.
Table listing the top 10 most populous New York counties in 2025—ideal for sourcing New York real estate leads, with rank, county, population, and principal cities or communities.

Population figures are Census Vintage 2025 estimates published by the Cornell Program on Applied Demographics.

Suffolk closed 13,111 sales in 2025, more than any other county in the state. Kings has the largest population in New York and a fundamentally different business behind it. Onondaga, which contains Syracuse, sits eleventh at 466,584 residents and therefore never appears on a top-ten population list at all. A team choosing ground off population rank alone walks past it.

So we ran the numbers a different way.

The New York Department of State publishes its active real estate license file daily, listing every salesperson and broker holding a current license along with a business address. The New York State Association of REALTORS® publishes closed sales by county. Our analysis joined the two.

One caveat belongs in front of the table, because any working broker will raise it immediately. The raw licensee count means little on its own, since a large share of licensed agents close nothing in a given year. The ratio between counties matters more than the headline count, because whatever share of licensees sits inactive applies roughly evenly across all of them.

CountyActive licenseesClosed sales, 2025Closed sales per licensee
Oneida6611,5782.39
Monroe3,5187,0202.00
Onondaga2,1884,1411.89
Erie4,3547,4611.71
Ulster1,1051,7211.56
Orange2,2822,9851.31
Dutchess2,0592,4831.21
Suffolk13,83713,1110.95
Rockland2,5022,2980.92
Westchester9,8337,5820.77
Nassau16,5999,8380.59

The spread runs about four to one, and it runs upstate. Roughly six in ten of New York’s licensees list a business address in New York City, Nassau, Suffolk, or Westchester, the end of the table where transactions per licensee are thinnest. Those are also the counties where the owner base is shallowest. The deep owner bases and the favorable ratios sit in the same places, and those places are not where most agents are standing.

Three caveats belong on the record. The county field records a licensee’s business address rather than where they transact, so a White Plains brokerage counts in Westchester while selling in Putnam. The five New York City counties are left out because the state association’s Manhattan data is incomplete and borough licensees do heavy rental and cooperative business that never reaches a sales count. Albany, Saratoga, Schenectady, Rensselaer, Montgomery, and Schoharie are left out because the Greater Capital Association of REALTORS® reports them separately.

None of that changes the shape. A team in Oneida or Monroe County works a market with roughly three times the closed sales per licensed agent that a Nassau team works, in counties where seven in ten households own their home.

Check whether your county is still open.

Conditions across New York’s regions

No two New York regions hand an agent the same conditions, and the differences run wider than any statewide average shows.

Empire State Plaza in Albany, New York, the civic center of the Capital Region real estate market
The Capital Region grew 1.0% since 2020 on the strength of Schenectady and Saratoga counties.
Table showing New York regions’ 2025 population, percent change since 2020, housing market trends, and insights for generating New York real estate leads in each region.

Population figures come from the Cornell Program on Applied Demographics; market figures from the New York State Association of REALTORS® 2025 annual report.

The Mid-Hudson is where New York is growing. Rockland added 5.6% since 2020 and Orange 4.1%, the two strongest county gains in the state, and Orange County’s median moved from $350,000 in 2021 to $450,000 in 2025. Dutchess, Ulster, and Sullivan all grew as well. For a team, this is the region where new owners keep arriving and the owner base is expanding rather than turning over in place.

Long Island runs on price. Nassau’s 2025 median reached $805,000 and Suffolk’s $670,000, and Suffolk closed 13,111 sales, more than any county in New York. The equity conversations here involve the largest numbers in the state outside Manhattan, and the property tax load is among the heaviest in the country.

The Capital Region grew 1.0% on the strength of Schenectady and Saratoga. Note a practical wrinkle for anyone comparing county data: Albany, Saratoga, Schenectady, Rensselaer, Montgomery, and Schoharie report through the Greater Capital Association of REALTORS® rather than in the state association’s county tables, so those counties will look absent from statewide county lists.

The Finger Lakes and Western New York are where homes sell fastest and above asking. Monroe County ran 0.5 months of supply in 2025 with sellers receiving 115.1% of original list price, and Wayne County reached 110.4%. Statewide the figure is 101.6%. Erie County closed 7,461 sales, up 2.2% in a year when the state was flat, at 1.2 months of supply and 105.4% of list. Ontario, Livingston, Genesee, and Niagara all cleared 100%. Both regions lost population since 2020, and both are seller markets. Those two facts sit together without contradiction, and any read that treats a falling headcount as a falling transaction count has confused the two.

The Kodak building in Rochester, New York, in Monroe County, the tightest seller market in the state
Monroe County ran 0.5 months of supply in 2025, with sellers receiving 115.1% of original list price.

Central New York is the region with a date on its calendar.

The Micron build in Onondaga County

Micron’s semiconductor campus in the Town of Clay is the largest private investment in New York’s history. The Governor’s office put the figures on the record in October 2025: up to $100 billion, 9,000 direct jobs on site, and over 50,000 new permanent regional jobs across thirty years, alongside tens of thousands of construction jobs over twenty. The campus will hold roughly 2.4 million square feet of clean room, the largest in the nation, and by the end of the decade one in four US-made chips is projected to come from in and around Upstate New York.

The figure a team should mark is not the headline investment. State projections put an additional $3.3 billion of annual disposable income into Central New York by 2035, averaging $5.4 billion a year through 2055. That is buying power arriving on a published schedule, in Onondaga and the ring counties around it: Madison, Oswego, Cayuga, and Oneida. Onondaga’s median already climbed 48.5% between 2021 and 2025, the largest four-year gain of any large county in the state, at 1.2 months of supply.

Supply has started to move with it. Onondaga County issued more than 1,700 housing permits in 2025, a 400% increase over two years, and upward of 1,300 of those were multifamily units, better than double the county’s ten-year average, according to County Executive Ryan McMahon’s March 2026 State of the County address. Stock is arriving on roughly the same clock as the buying power, which rewards the team already known in Onondaga and its ring counties when those buyers show up.

The Mohawk Valley, Southern Tier, and North Country lost population since 2020, at 1.0%, 2.1%, and 2.9% respectively. Those are real numbers and worth planning around, but they describe how many people live in a region, not how many homes change hands there. Oneida County, inside the Mohawk Valley, closed 1,578 sales in 2025 and carries the highest closed-sales-per-licensee ratio in this article. Jefferson County closed 1,133, up 10.3% on the year. Steuben rose 7.3%, Chemung 3.4%. A region can hold fewer residents each year and still hand a well-positioned team more transactions per agent than Nassau County does.

Counties and communities beyond the metros

New York’s growth over the past five years has not happened in its largest places, and the counties where a single team can still hold an entire market are the ones most agents never plan around.

Colorful waterfront buildings in a small New York river town with boats docked along the shore
An owner in Cooperstown or Rhinebeck thinks of themselves as living in that village, not in a county.
CountyPopulation, 2025Change since 2020Communities
Saratoga241,343+2.5%Ballston Spa (county seat), Saratoga Springs, Clifton Park, Malta
Schenectady162,581+2.9%Schenectady (county seat), Niskayuna, Rotterdam, Scotia
Dutchess300,708+1.2%Poughkeepsie (county seat), Beacon, Rhinebeck, Fishkill
Ulster183,330+0.8%Kingston (county seat), New Paltz, Saugerties, Woodstock
Ontario113,130+0.6%Canandaigua (county seat), Geneva, Victor, Naples
Oswego118,569+0.9%Oswego (county seat), Fulton, Pulaski, Phoenix
Otsego60,589+3.6%Cooperstown (county seat), Oneonta, Richfield Springs, Milford
Sullivan80,586+2.5%Monticello (county seat), Liberty, Callicoon, Livingston Manor
Warren65,020-1.1%Lake George, Glens Falls, Queensbury, Bolton Landing
Montgomery50,046+1.0%Fonda (county seat), Amsterdam, Canajoharie, St. Johnsville

Population figures come from Census Vintage 2025 estimates published by the Cornell Program on Applied Demographics.

Look at the growth column. Montgomery County, with roughly 50,000 residents, was the fastest-growing county in all of New York in the most recent year at 0.94%. Otsego added 3.6% since 2020, third-best in the state. Sullivan added 2.5%. None of those counties holds a major metro, and none of them shows up in a conversation about where New York real estate is happening.

Transaction activity followed. Warren County closed 780 sales in 2025, up 12.7% on the year. Oswego closed 949, up 7.0%. Sullivan closed 806, up 4.1%. Ulster closed 1,721, up 3.4%. Those are gains posted in a year when the statewide number moved 0.1%.

These counties matter for the reason this whole article has been circling. Homeownership runs highest here, well above the 70% mark that 35 of New York’s 62 counties clear, which means the owner base per capita is deeper than anywhere downstate. The transaction-per-licensee math from earlier favors them by roughly three to one. The competitive picture changes shape entirely at this scale. A team that becomes the recognized name in Otsego or Montgomery County is up against a handful of local firms, where the same team in a downstate metro would be one of several thousand licensees.

Communities carry weight here that census tracts do not. An owner in Cooperstown, Rhinebeck, Skaneateles, or Bolton Landing thinks of themselves as living in that village, not in Otsego or Dutchess or Warren County. The teams that win these markets are the ones whose name attaches to the village, and that recognition compounds over the eleven years a typical owner sits in the house before calling anyone.

The owner who leaves still owns a house here

A past client who begins planning a move out of the area pulls the agent’s attention toward the purchase they cannot serve, and the listing they were positioned to win changes hands to somebody else before they ever see it coming.

Rocky overlook above an Adirondack lake in New York surrounded by forested hills in fall color
A departing owner still owns a house in your county. That house is a listing and a referral both.

Start with the size of the flow, because the story most people carry about New York migration is running behind the data. Net domestic migration was negative 130,436 in the 2024 American Community Survey. In 2021 it was negative 283,792. In 2018, before the pandemic, it was negative 203,567. Fewer New Yorkers are leaving on net today than were leaving in 2018.

The gross numbers matter more than the net for anyone building a pipeline. Across New York’s ten largest migration-partner states in 2024, 700,172 people moved in or out. That nets to negative 130,436, which works out to roughly 285,000 people arriving from those ten states against roughly 415,000 departing. Close to seven people move in for every ten who move out. New York posted outright net gains from California at 6,440, Colorado at 4,193, and the District of Columbia at 1,678. New Jersey and Florida sit in the top three for both directions.

The population line closes the argument. New York counted 20,203,696 residents at the 2020 Census, bottomed at 19,713,025 in 2022, and stood at 20,002,427 on July 1, 2025. That leaves the state one percent below 2020 and up 289,402 from the trough. Natural increase now runs about 43,000 a year against net international migration of roughly 100,000. All of these figures come from the Cornell Program on Applied Demographics, working from Census and ACS data.

Now the part a team can act on. Every departure is two pieces of business, not one. The purchase happens in a market the agent cannot serve, and it is the piece everyone fixates on. The listing is the house the client still owns in the agent’s own county, and it is worth more to that agent than the referral fee on the other end.

That listing is what slips. A client planning a move wants a feel for what their money stretches to in the new market, so they open a legacy portal, connect with whoever is attached to a listing there, and start a relationship the original agent never sees. The home in the agent’s market then lists with that new contact.

Census figures put the base rate at roughly 2.1% of Americans moving to a different state each year, and another 3% or so moving to a different county within their own state. Over the years a team stays in touch with a client, those odds compound.

National coverage changes what the agent can see. When the client researches Charlotte or Tampa or Saratoga on the partner’s own co-branded platform instead of leaving for a portal, that search surfaces as an early signal, months before anything lists. The agent reaches out while the local listing is still winnable, talks through selling the current home, and refers the client onward for a fee. The move stops being a loss and becomes two transactions.

Remote and hybrid work is a settled buying signal in New York’s smaller counties

Remote work stopped shrinking several years ago, and the federal data has refused to cooperate with the obituaries ever since.

A winding road through autumn foliage toward a Finger Lakes lake in New York
The counties positioned to capture lasting remote and hybrid demand are the ones agents plan around least.

In the fourth quarter of 2024 the Bureau of Labor Statistics put the number of Americans doing at least part of their work from home at 36.7 million, against 32.5 million in the same quarter a year earlier, and the national telework rate reached 23.4%. Employers say the same about their own plans. The Business Trends and Outlook Survey, run by the Census Bureau across roughly 150,000 US firms, found 31.2% with at least one employee putting in a full day from home, and those same employers projected that level holding five years out. Pew’s October 2024 survey found 75% of employees whose jobs can be done remotely working from home at least some of the time.

The migration consequence shows up in federal data too. Rural counties gained 974,000 net migrants between 2020 and 2024 according to the USDA Economic Research Service, and the inflow concentrated in working-age adults between 25 and 44 instead of retirees. That is the remote-work-eligible cohort, and it is the first sustained rural in-migration of its kind in decades.

Every figure above is national. None of them becomes a New York statistic by being repeated next to one, and any agent quoting them as local numbers will get caught. What they establish is that the demand is real and lasting. New York’s own growth data establishes where it is landing.

The Mid-Hudson counties sit inside reach of the city without city pricing, which is why Rockland and Orange lead the state in growth and why Dutchess, Ulster, and Sullivan followed them up. The Capital Region ring runs the same pattern through Saratoga, Schenectady, Rensselaer, and Washington. Otsego, Warren, and the Finger Lakes counties offer the lifestyle version of it. Those are the same counties that showed up in the growth rankings earlier in this article, and the overlap is not a coincidence.

What matters for a working team is what these buyers ask for, because it differs from what listing copy in those counties usually describes. They want a room with a door that closes, not a corner of the dining area. Households running two remote jobs look for a separate structure or an accessory dwelling unit. They need more square footage than the same budget bought them before. And they need broadband that holds a video call, which across parts of the North Country and the Southern Tier is a genuine filter on which homes are even viable.

A partner who knows which streets in Saugerties or Ballston Spa have the service, and who prices a home office as a feature rather than a spare bedroom, is talking to that buyer directly. Most listings in those counties still say “bonus room.”

See whether your county is still available.

Why you cannot simply call them

A man and woman sit at a cafe table, discussing New York real estate leads with a house photo, while a laptop and notebook are on the table.

The obvious way to reach an owner who is years from listing is to pick up the phone, and New York restricts that channel more tightly than most states realize.

New York General Business Law section 399-z is the state’s telemarketing and do-not-call statute, and it carries a provision that catches real estate prospecting directly. Subsection 5(a) makes it unlawful for a telemarketer doing business in New York to knowingly make an unsolicited telemarketing sales call to any person located in a county, city, town, or village under a declared state of emergency or disaster emergency, under sections 24 or 28 of the Executive Law. Statewide declarations count. The New York State Association of REALTORS® maintains a standing advisory on this and tracks which executive orders are live, because the answer changes.

Cold calling is not prohibited outright in New York. It is heavily conditioned, and during declared emergencies it is prohibited, and those declarations recur often enough that the association keeps a running page about it. None of what follows is legal advice, and any team running a calling program should be checking with their broker, their counsel, and that advisory rather than with an article.

The penalty structure is what makes this a broker’s problem rather than an agent’s. Violations carry a civil penalty of up to $20,000 each after notice and a hearing, every unlawful call counts as a separate violation, and the Division of Licensing can run suspension or revocation proceedings alongside. A dialer that makes several hundred calls into a covered area generates several hundred violations.

The routine obligations sit on top of that. Calls are restricted to the hours between 8am and 9pm at the consumer’s location. Opening disclosures are required. An internal do-not-call list has to be maintained and honored firm-wide, across every office and every agent, not agent by agent. And the statute carries a 24-month record-retention expectation covering dialing lists and their sources, proof of registry scrubs, suppression lists, and opt-out logs. A compliance program that cannot produce those records tends to get treated as no compliance program at all.

Then there is section 175.25 of the Department of State’s regulations, which is where this stops being about the person who dialed. New York treats marketing and communications as part of the regulated brokerage business, so a broker who supplies scripts, distributes lists, or adopts calling tools is supervising a brokerage activity. The exposure runs to the broker-owner and the team lead.

Purchased lists make it worse rather than better. If a consumer on a vendor’s FSBO or expired list files a complaint and never gave consent, the law puts the job of proving consent on the broker, not on the consumer, and not on the vendor who sold the list.

One more constraint shapes the early conversation. In April 2026 HUD issued a “Dear Colleague” letter telling licensees that discussing neighborhood crime rates and school quality does not violate federal fair housing law. NYSAR’s published position is that New York law is separate and its members may still face state liability for those discussions. So the two questions a planning buyer asks most are the two a New York licensee is least free to answer, which raises the value of a platform where the consumer researches schools, taxes, and neighborhoods on their own.

None of this touches the approach that works. Nothing in section 399-z restricts sending an owner an accurate number about their own home, and nothing restricts being the place they already go when they want to look.

How teams work the database today, and where each approach breaks

Three people in business attire meet at a desk discussing New York real estate leads; one speaks via headset while others listen and take notes amid charts, documents, and computers.

Every serious New York team already knows the database is the cheapest business they will ever get, and most of them have bought something to work it. Each of those tools solves a real piece of the problem, and none of them solves the piece that matters most.

Predictive-seller software scores a database and ranks who might list. The scoring works reasonably well. What it produces is a name with a probability attached, and a probability is not a relationship. Somebody still has to build the one that turns a high score into a signed listing agreement, and in New York that somebody is working under the calling constraints from the previous section.

A home-value tool sends an automated estimate every month. That is a genuinely useful thread, and it is one thread. It tells an owner a number without giving them anywhere to go with it, and it does not know whether they opened it because they are curious or because they are eighteen months from a move.

A done-for-you content service fills the inbox with material the team did not have to write, and that is worth something. It is also one more subscription and one more system to administer, it sits apart from wherever the client spends their time, and what it produces is opens rather than intent.

Generic all-in-one platforms promise to hold all of it together. In practice the team spends the first quarter configuring the thing and every quarter after that administering it. The tool becomes a job.

Shared leads bought from legacy real estate portals get sold to several teams at once, and they are priced highest in exactly the downstate counties where the transactions-per-licensee math from earlier is worst. A team in Nassau pays the most per lead to compete with the most agents for the fewest deals per head.

Paid ads and self-produced content work while the spend and the calendar hold. Both stop the week they slip.

Door knocking and farming still produce in New York, precisely because neither is a phone call and neither runs into section 399-z. They are also capped by the number of hours in one person’s week, which is a ceiling no amount of skill raises.

Underneath all of it sits the same structural gap. None of these is a place a past client goes back to on their own. They are all outbound, and outbound decays.

The list decays too, whether or not anyone works it. Something on the order of 15% to 22% of email addresses stop working every year, and as many as one in ten people change their phone number. A database that looked complete eighteen months ago is partly unreachable today, and the contacts that go dark first are frequently the ones worth the most.

What changes the math is a place the client returns to voluntarily, month after month, for their own reasons. They come back to watch their value, to check what their taxes are doing, and to see what the house down the street just sold for. That kind of engagement turns a name in a CRM back into a conversation, and the conversion window it produces runs 30 to 60 days rather than the same afternoon.

What an Exclusive County Partnership gives a New York partner, and why counties close

An Exclusive County Partnership hands one agent, team, or brokerage an entire New York county, co-branded across the consumer experience, and no second partner works that territory. The partner owns the leads. There is no charge per lead and no share of the commission at closing, so a strong month in Erie or Dutchess County is a strong month rather than a bigger invoice.

A real estate agent talking with an older couple outside their suburban New York home
The connections that start on the platform tend to last past one closing.

That structure matters more in this state than in most, for a reason the earlier sections established. Where a Nassau team pays the highest per-lead prices in New York to compete with the largest concentration of licensees for the fewest closed sales per head, a county-exclusive partner in Monroe or Oneida is not bidding against anybody for the same names.

The connections convert differently too. Somebody who reaches a partner by way of ez Home Search did not come off a purchased list. They have been using the platform, they have shown intent through actual activity, and they are matched with one vetted local expert rather than sold to a rotation of whoever paid most. The Only Confidential Home Search is the name for that arrangement. Nobody sells, recycles, or forwards a person’s contact details and budget to a list of companies they never picked, and the search remains their own. ez Home Search treats that as the baseline, and it is the clearest expression of what the company promises with A Better Way To Discover Real Estate. Relationships that begin there tend to outlast a single closing.

The database you already own

The largest return available to a New York partner is not the new business. It is the database they already have, and the numbers on that are stark. Between 88% and 92% of buyers say they would use their agent again or recommend them, while only about 18% buy through an agent they have worked with before. Repeat and referral business already accounts for roughly 41% of the average agent’s volume. The gap between 90% and 18% is the whole opportunity.

ez Home Search handles that reactivation on the partner’s behalf, co-branded and done for them. Partners reactivate past clients, whether through repeat business or referral, at 2.5 to 5 times the market rate. The mechanism is not a newsletter. Past clients keep returning to the co-branded home search, the home value updates, and the listing alerts on their own, which is also how their current email and phone stay current instead of decaying at the 15% to 22% annual rate from the previous section.

The number the early owner is looking for

Equity, a life event, timing, and taxes are what move a New York owner to sell. Every one of those is a question with a number as its answer, and the partner has the engine. The automated valuation model covers any US residential property, and the property-tax detail runs by state, county, city, and ZIP, which is what makes the carrying-cost conversation real in Nassau, Rockland, and Westchester. The consumer also researches schools and neighborhoods themselves, which carries particular weight in New York given the state liability question around those discussions.

Knowing who is close

A contact who picks an old search back up, runs a second valuation, or revisits a saved home is closer to a decision than one who has gone quiet. ez Home Search tracks that and surfaces it in the CRM the team already runs. The connection is fullest in Follow Up Boss, where activity and saved homes appear in the dashboard and ezNurture handles automated follow-up, and it runs deepest in Sure Send™.

Consent proof, in the state that needs it most

Given section 399-z and the supervision rules, the compliance piece is not a nice-to-have for a New York broker. ezVerify.ai establishes that the person opted in and holds the recording that shows it, checks the number against a known-litigator database ahead of the first dial, and screens out anything sitting on the Do Not Call registry. It also enriches the contact record. Think of the whole thing as documentation rather than scoring. When a consent dispute arrives, it meets a record instead of an argument.

And when a past client starts searching Charlotte or Sarasota, that activity surfaces on the partner’s own platform in time to win the listing they still own in Ontario or Ulster County, rather than after it has gone to a stranger.

Why counties close

One partner holds a county. That is the whole model, and it is also its constraint. A meaningful share of New York’s 62 counties are already claimed, more get taken every month, and the county exclusivity partners we work with consistently tell us the position compounds the longer they hold it. Whether a specific county is still open is not something an article can answer.

The decision in front of you

Three people sit at a table in a modern office with a city skyline view, discussing pictures in a New York real estate leads brochure.

Three paths sit in front of a New York team that has read this far, and only one of them is new.

Most teams will stay where they are, competing for the small share of New York owners who have already raised a hand, in the counties where the most licensees chase the fewest transactions per head. The channel that gets them there is one the state periodically takes off the table, and the exposure lands on the broker’s license rather than the agent’s. It works. It has worked for years. It gets harder every year that the median hold stretches longer.

A team can also build the alternative itself. That means the property data, the valuation modeling, a consumer search experience good enough that people return to it voluntarily, the listing alerts, the home value updates, the consent infrastructure, and the engineering to keep all of it running every minute of every day. Teams have tried. The data sourcing alone puts it out of reach for almost any single brokerage, and every hour spent administering it is an hour not spent on a client.

The Exclusive County Partnership is the one that is new. One team holds the county. The leads belong to the partner, with no charge per lead and no share of the commission. The platform is already built and already carries millions of consumers, and the partner’s brand sits on it across the county.

The cost side is straightforward. This is a territory commitment with a predictable fee attached, and it works on a 30 to 60 day conversion rhythm rather than a same-week one. A team that needs a closing this month should know that going in, because the model is built around owners who are years out, not days out.

The number worth remembering is what happens to the database a partner already owns. Partners reactivate past clients, through repeat business and referral, at 2.5 to 5 times the market rate. That figure covers no new names at all. It describes the contacts already sitting in the CRM, the ones the team earned once and then watched go quiet.

If you work in one of the 35 New York counties where more than seven in ten households own their home, the owners who will hand you listings in 2029 are sitting in those houses right now, eight years into an eleven-year hold, telling nobody. The only question that has a deadline attached is whether your county is still open.

Check whether your county is available.

Frequently asked questions

Why is New York’s homeownership rate the lowest in the country if most of its counties are above 70%?

Both facts are true at once, and the explanation is housing stock rather than appetite. New York’s statewide rate sits near 54%, the lowest of the fifty states, because four counties with enormous populations are dominated by rental buildings. Manhattan is 90% buildings of ten or more units, the Bronx 68%, Brooklyn 42%, and Queens 36%, and their ownership rates run from 20% to 45%.

Outside those four, every county in the state exceeds the statewide average and 35 of 62 clear 70%, according to the New York State Comptroller’s analysis of Census data. A team planning against the statewide number is planning against a figure that describes almost none of the state’s geography.

Can New York real estate agents legally cold call FSBOs and expired listings?

Sometimes, and the answer changes depending on what emergency declarations are active, which is why this is a question for your broker and your counsel rather than an article. Cold calling is not prohibited outright in New York. It is heavily conditioned by General Business Law section 399-z, and during a declared state of emergency or disaster emergency it is prohibited into the affected county, city, town, or village, including under statewide declarations.

Penalties run up to $20,000 per violation, with each call treated separately, and the Department of State’s supervision rules put the responsibility on the broker for calling conducted under the brokerage’s name. Purchased lists shift the burden the wrong direction, because a broker facing a consent complaint has to prove consent existed. The New York State Association of REALTORS® keeps a running advisory on which declarations are live.

Does New York City’s new second-home surcharge change what a pied-à-terre is worth?

It very likely does, and by more than most owners expect. The surcharge enacted in May 2026 applies to New York City residential property that does not serve as the owner’s primary residence, took effect July 1, 2026, reaches back to obligations from January 1, 2026, and is written to sunset June 30, 2031. A recurring annual carrying cost comes out of a sale price rather than being added to it, because buyers price on what a property costs to hold.

The size depends entirely on whether buyers believe the sunset. On a $6 million townhouse paying 0.8%, five years of surcharge discounted at 5% is worth roughly $208,000. The same charge priced as permanent capitalizes closer to $960,000. Those are illustrative figures on stated assumptions, and none of this is tax advice, but the spread is the conversation an owner needs to have with somebody before they decide to hold or sell.

One caution for anyone quoting rates: the 4% to 6.5% brackets that apply to co-ops and larger condos are calculated against the Department of Finance’s comparable-rental valuation, which runs well below sales price. Apply those percentages to a unit’s market sale price and you badly overstate the bill.

Why do homes in Monroe County and the Rochester area sell so far above asking price compared with the rest of New York?

Supply is the whole answer. Monroe County ran 0.5 months of inventory in 2025, the tightest in the state, and sellers there received 115.1% of original list price against a statewide figure of 101.6%. Neighboring Wayne County reached 110.4%.

Two things get conflated here and they should be kept apart. Months of supply counts homes sitting on the market at a moment, while closed sales count completed transactions over a period. Monroe closed 7,020 sales in 2025, up 1.9%. Tight supply and healthy transaction volume are describing the same competitive market from two directions.

Is the Micron project in Clay going to change how many listings Onondaga County agents see?

The demand side is on a published schedule, and the timing favors teams that establish themselves early. State projections tied to the $100 billion campus put an additional $3.3 billion of annual disposable income into Central New York by 2035, rising toward an average of $5.4 billion a year through 2055, alongside 9,000 direct jobs and more than 50,000 new permanent regional jobs over thirty years.

Onondaga’s median sale price already rose 48.5% between 2021 and 2025, the largest four-year gain among the state’s large counties, and the county was running 1.2 months of supply. Construction is responding: the county issued more than 1,700 housing permits in 2025, over 1,300 of them multifamily, more than twice its ten-year average, according to County Executive Ryan McMahon’s March 2026 State of the County address. An agent who is the recognized name in Onondaga, Madison, Oswego, or Cayuga County before 2030 is positioned for a demand curve that has dates attached to it.

Are people still leaving New York, and does that mean fewer listings for agents upstate?

New Yorkers are still leaving on net, and fewer are leaving than before the pandemic. Net domestic migration was negative 130,436 in the 2024 American Community Survey, against negative 203,567 in 2018. Across the state’s ten largest migration-partner states, 700,172 people moved in or out that year, roughly seven arriving for every ten departing. The state’s population bottomed at 19,713,025 in 2022 and stood at 20,002,427 on July 1, 2025.

For an upstate team the practical read runs the other way from the headline. A departing owner still owns a house in your county, and that house is a listing plus a referral if you learn about the move before the listing agreement gets signed somewhere else.

08.05.2026

How to Generate Real Estate Leads in New Hampshire’s Growing, Undersupplied Market

In New Hampshire, most of the people who will buy or sell a home over the next year or two are already searching listings, checking their home’s value, and researching neighborhoods, long before any agent hears from them. On a legacy portal, that early activity gets captured and sold as a cold lead, the same name handed to a crowd of agents at once. ez Home Search works the other way around. It is where those buyers and sellers research privately, co-branded to a single county partner, so the New Hampshire real estate leads it produces arrive warm, carry the person’s search history, and belong to one agent instead of five.

There are more of those people than most agents realize, and they sit on both sides of the move. New Hampshire’s growth is almost entirely inbound: between 2020 and 2024 deaths outran births by about 9,200, yet the state still added roughly 31,500 residents because net migration brought in around 40,100 people (Carsey Institute at the University of New Hampshire; U.S. Census). Underneath those arrivals is the far larger group of New Hampshire owners already here who will move over the years. ez Home Search surfaces both the moment their activity shows they are ready and hands them to the county partner as the trusted local name. Before you read further, it is worth checking whether your New Hampshire county is still open to a partner.

New Hampshire’s housing market is steady, expensive, and tight on supply

A person uses a smartphone to view a map with location markers while walking on a sidewalk outdoors, possibly searching for New Hampshire real estate leads.

New Hampshire’s housing market is steady and still appreciating, and the numbers that matter for lead generation show up in both the sales counts and the prices. In 2025 the statewide median single-family price reached a record $535,000, up 3.9% over 2024, the smallest annual increase in a decade (New Hampshire REALTORS). Set against a ten-year average of about 8.5% a year, that tells you prices are still rising but the pace has cooled toward something sustainable, mostly because affordability finally caught up with buyers. Sales climbed across every product type. Single-family closings hit 12,529, up 4.5%. Condominium sales rose 6.6%, and manufactured-housing sales jumped 12.2%. Buyers and sellers are both active, which is exactly what a working market looks like.

The real pressure is on supply. New Hampshire carries roughly two months of inventory, well under the five to seven months a balanced market needs. The state Realtor association’s affordability index sat at 58 in 2025, meaning a typical household earns about 58% of the income needed to qualify for the median home, and the index last cleared 100 back in 2021. Rentals are just as tight. New Hampshire Housing’s 2024 survey put the two-bedroom vacancy rate near 0.6%, a sliver of the roughly 5% that signals a balanced rental market (New Hampshire Housing; New Hampshire Fiscal Policy Institute).

One distinction changes how an agent should read all of this. Transaction volume is the flow of deals closing, and it is steady and rising. Inventory is the stock of homes for sale at any given moment, and it is scarce. A low inventory number does not mean fewer people are selling. It means homes sell quickly and owners hold longer between moves. Scarce inventory at record prices is a supply story, and it is a very different thing from a market that is fading.

That supply story is the whole opportunity. When listings are scarce and every agent is fighting for them, the one who wins is the name an owner already knows before the home reaches the market. Record prices also mean owners are sitting on more equity than ever, so the seller who lists this year has real reason to move. You will not win those listings by buying the same shared leads everyone else buys. You win them by being the recognized local name a homeowner thinks of first, and that is what the rest of this piece is about, county by county.

New Hampshire’s demand is mostly local owners moving, with in-migration adding growth on top

Bar chart comparing New Hampshire real estate leads conversion: Exclusive County Leads at 28%, Shared Market Leads at 2%. Exclusive New Hampshire real estate leads show a significantly higher conversion rate.

Most New Hampshire buying and selling is local owners trading one home for another, and in-migration is the smaller piece that makes the state grow at all. Start with the base. New Hampshire has about 555,000 households, roughly 73% of them owners, which is on the order of 400,000 owner households (U.S. Census). The state closed about 12,500 single-family homes and 4,300 condominiums in 2025 (New Hampshire REALTORS), and with manufactured housing added in, total home sales run roughly 17,000 to 18,000 a year. That is only about 4% of owned homes changing hands in a given year. This steady turnover, not a wave of newcomers, is where most transactions come from, and it is why being the recognized local name matters more than chasing arrivals.

In-migration sits on top of that base, and it is real. Net migration added roughly 40,000 people from 2020 to 2024, about 10,000 a year, which pencils out to something like 4,000 new households annually (Carsey Institute at the University of New Hampshire; U.S. Census). Against 17,000 to 18,000 annual sales, arrivals drive very roughly one transaction in six. Migration matters less because it is large and more because it is the only reason the state grows: births have not kept up with deaths in years, so those newcomers are what keep New Hampshire from losing population. For an agent, the newcomer is a real and nameable opportunity, not the whole market.

Where those newcomers land is worth knowing. Massachusetts is the largest source, and the Seacoast is the marquee destination. That state’s 2022 surtax on very high incomes has pushed some earners north to establish New Hampshire residency, where there is no state income tax, no general sales tax, and no estate tax, while many keep their Boston-area jobs about an hour south (Boston Globe, July 2026, citing The Warren Group and New Hampshire REALTORS). Seacoast prices show it: the median single-family home runs around $867,000 in Portsmouth, about $650,000 in Exeter, and roughly $575,000 in Dover. Arrivals are buyers; owners who leave, whether they head to Maine or across the country, are listings and relocation business. A departure does not have to end the relationship. Caught early, it becomes a listing and a referral instead of a client the agent never sees again.

The jobs behind all of this are steady and diversified, which keeps demand from riding on any single employer. Unemployment sat at 3.0% in May 2026, among the lowest in the country, across roughly 700,000 nonfarm jobs (U.S. Bureau of Labor Statistics). Professional and business services and education and health care have been adding jobs, while manufacturing and trade softened slightly, so the base is broad. The anchors are concrete. BAE Systems employs 6,774 people in New Hampshire, most of them in Nashua, and is the state’s largest manufacturing employer, with an $85 million expansion of its Hudson campus announced in 2026 (New Hampshire Business Review). Around it, the Manchester and Nashua area is building a biofabrication cluster nicknamed ReGen Valley, backed by a $44 million federal Tech Hub grant (U.S. Economic Development Administration).

Researcher pipetting samples in a New Hampshire biotech lab in the Manchester and Nashua ReGen Valley cluster
New Hampshire’s Manchester and Nashua area anchors a growing biofabrication cluster.

The people arriving are also younger than the state as a whole. New Hampshire’s median age is 43.4, the second-oldest in the country, and about one in five residents is 65 or older. Yet roughly 60% of recent in-migrants are between 18 and 44 (New Hampshire Fiscal Policy Institute). That gives an agent two live pools at once: long-tenured owners who will eventually downsize or sell, and younger move-up and first-time buyers arriving with jobs. An agent’s job is to serve both, and the platform they stand on decides whether they meet those people early or late.

New Hampshire’s regions, from the Seacoast to the North Country

New Hampshire is really several markets at once, and each region hands an agent a different way to generate business. The Seacoast, anchored by Portsmouth, Hampton, Exeter, Rye, and Dover, is the priciest corner of the state and the front door for Massachusetts buyers trading a Boston commute for New Hampshire residency. Those buyers arrive with budgets, and the owners already there sit on years of equity, so the region is thick with both listing and buyer opportunity for the agent who reaches people first.

Greater Manchester and Nashua, together with Concord and the rest of the Merrimack Valley, is the population and jobs core. About 74% of the state lives in the four southeastern counties, and the biotech and advanced-manufacturing growth around Manchester keeps move-up demand steady even as new construction lags the number of people arriving. The Lakes Region, from Laconia to Meredith, Wolfeboro, and Moultonborough, runs on second-home and waterfront demand around Lake Winnipesaukee and has posted some of the fastest town-level growth in the state. The White Mountains and North Country, including Conway, North Conway, Lincoln, and Littleton, draw recreation and lifestyle buyers, and Carroll County has been the fastest-growing county in New Hampshire.

Lakefront homes among the trees on a New Hampshire lake in the Lakes Region
Waterfront demand drives the Lakes Region around Lake Winnipesaukee.

The Upper Valley around Lebanon and Hanover is its own economy, anchored by Dartmouth College and Dartmouth Health, and it pulls a steady stream of relocating medical and academic buyers who need local guidance in a market they do not know. The Monadnock Region around Keene and Peterborough stays more affordable than the southern tier, which makes it a landing spot for buyers priced out closer to the border.

Prices moved differently by region in 2025. Carroll, Grafton, and Merrimack counties each posted gains above 6%, while Coos and Sullivan counties saw slightly lower prices. That spread is ordinary regional variation inside one steady market, not a sign that any part of the state has stopped selling. For an agent, it is a map of where equity is building fastest and where affordability is drawing the next wave of buyers.

RegionAnchor marketsWhat is happening
SeacoastPortsmouth, Hampton, Exeter, Rye, DoverPriciest market in the state; Massachusetts tax-move demand; Portsmouth median around $867,000 (Warren Group; NHAR)
Greater Manchester–Nashua / Merrimack ValleyManchester, Nashua, ConcordPopulation and jobs core; ~74% of the state in the four southeast counties; biotech growth; building lags arrivals (NHFPI; EDA)
Lakes RegionLaconia, Meredith, Wolfeboro, MoultonboroughSecond-home and waterfront demand on Lake Winnipesaukee; among the fastest-growing towns 2020–2024 (Carsey; NHFPI)
White Mountains / North CountryConway, North Conway, Lincoln, LittletonRecreation and lifestyle buyers; Carroll the fastest-growing county at +5.0% (Carsey; NHFPI)
Dartmouth–Lake Sunapee / Upper ValleyLebanon, Hanover, New London, ClaremontDartmouth College and Dartmouth Health anchor; Grafton price gains above 6% in 2025 (NHAR)
Monadnock RegionKeene, Peterborough, JaffreyMore affordable than the southern tier; steadier, flatter growth; Keene the regional anchor (NHFPI)

New Hampshire counties and communities, from the metros to the North Country

New Hampshire has just ten counties, and an agent who wants to own a market should know all of them, because the opportunity is not limited to the southern metros. The population core sits in the four southeastern counties, Hillsborough, Rockingham, Merrimack, and Strafford, where Manchester, Nashua, Concord, and Dover concentrate most of the state’s buyers and sellers. North and west of there, Belknap, Carroll, and Grafton carry the Lakes Region and White Mountain markets, where amenity demand and second homes drive activity. Cheshire, Sullivan, and Coos, along the western and northern edges, are the affordable end of the state, and they hold owner bases worth being the known name in even where prices sit lower.

Those price differences run through the rental market too. New Hampshire Housing’s 2024 survey put the median two-bedroom rent at about $2,069 in Rockingham County and roughly $1,161 in Coos, a gradient that mirrors where affordability pressure is highest and where buyers priced out of the south begin to look. Every county on the lists below has homeowners who will move eventually, and the agent who is the recognized name there captures that turnover instead of losing it to a portal.

Historic brick-lined main street in a New Hampshire town center
Every New Hampshire county has communities worth being the known name in.
CountyPopulation (2024)Principal cities and towns
Hillsborough426,378Manchester, Nashua, Bedford, Merrimack
Rockingham319,082Derry, Salem, Londonderry, Portsmouth
Merrimack155,967Concord, Franklin, Hooksett, Bow
Strafford132,575Dover, Rochester, Somersworth, Durham
Grafton92,120Lebanon, Hanover, Littleton, Plymouth
Cheshire77,297Keene, Swanzey, Jaffrey, Winchester
Belknap64,659Laconia, Gilford, Meredith, Belmont
Carroll51,804Conway, Wolfeboro, Moultonborough, Ossipee
Sullivan43,715Claremont, Newport, Charlestown, Sunapee
Coos31,271Berlin, Gorham, Lancaster, Colebrook

Beyond the big metros, the county map fills in with communities an agent can build a name around.

CountyCommunities
MerrimackConcord, Franklin, Hooksett, Bow
StraffordDover, Rochester, Somersworth, Durham
GraftonLebanon, Hanover, Littleton, Plymouth
CheshireKeene, Swanzey, Jaffrey, Winchester
BelknapLaconia, Gilford, Meredith, Tilton
CarrollConway, Wolfeboro, Moultonborough, Ossipee
SullivanClaremont, Newport, Charlestown, Sunapee
CoosBerlin, Gorham, Lancaster, Colebrook

The remote and hybrid buyer most New Hampshire agents still overlook

The remote and hybrid buyer is a lasting source of New Hampshire demand, and most agents still treat them as a fad that already passed. The stories declaring remote work finished measure it against the spring-2020 spike, a moment no one expected to hold. Line it up against how work looked before the pandemic and the number sits about three times higher, and it has stayed there. In the fourth quarter of 2024, federal Bureau of Labor Statistics figures showed 36.7 million Americans working from home at least part of the week, up from 32.5 million twelve months before, with the telework share rising to 23.4%. On the employer side, the U.S. Census Bureau surveyed roughly 150,000 businesses in its Business Trends and Outlook Survey and found they expect about the same amount of remote work half a decade out. That is a national baseline settling in place, not one on the way out.

That national shift lands on specific New Hampshire ground. The USDA reports that rural counties across the country gained about 974,000 net migrants between 2020 and 2024, reversing more than a decade of decline, with the arrivals skewing toward working-age adults. In New Hampshire, that means the Lakes Region, the White Mountains, the Monadnock Region, and the North Country, the affordable and lifestyle markets a buyer can finally choose because they need to be in a Boston or Manchester office only a couple of days a week. It also feeds the Seacoast and the southern tier, where the hybrid commuter keeps a city salary and buys where the living is better. The state’s own numbers already show it. Carroll County has been the fastest-growing county in New Hampshire, and its amenity towns are leading the way.

Person overlooking a New Hampshire lake and mountains with autumn foliage
The Lakes Region, White Mountains, and North Country draw remote and hybrid buyers.

For an agent, this is a buying signal worth naming out loud. Remote and hybrid buyers want a home that matches how they earn a living: a dedicated or closable office, an accessory dwelling unit (ADU) or separate structure when a spouse also works remotely, extra square footage, and broadband that genuinely keeps up. An agent who asks about a buyer’s work setup on the first call, and who knows which New Hampshire towns have both the space and the connectivity, reaches these people earlier and speaks to what they actually need. Most competitors are still treating them as a story that ended, and that gap is the opening.

Chasing only seller leads misses most of the New Hampshire market

An agent who chases only seller leads leaves most of the New Hampshire market on the table, because most buyers here are also sellers. The common mistake is to pick a lane. One agent markets “list with me” to sellers. Another buys cold buyer leads by the batch. Both handle the two sides of one move as though a different person sat on each, and both surrender the majority of clients who are doing both at the same time.

The numbers behind this are national and worth stating plainly. The National Association of Realtors’ 2025 profile put first-time buyers at just 21% of purchases, a record low, with the median first-time buyer now 40 years old. That leaves about four in five purchasers already sitting in a home they intend to sell so they can buy the next one. In New Hampshire that pattern runs even stronger, because the state is full of owners. About 73.3% of New Hampshire households own their home, among the highest rates in the country (U.S. Census, 2025). The equity gap is real too: the typical New Hampshire homeowner household earned about $114,853 in 2023, against $53,816 for renters, so the move-up seller sitting on years of appreciation is a deep and active pool.

Here is what that adds up to. Most people are buying and selling inside one move, so an agent who commits to a single side walks away from the bigger half of the client. The right platform reads which side is live at the moment. When someone runs a valuation or lands on a home-value page, the selling conversation has opened. When they build saved searches, open their alerts, and book a showing, the buying side is in motion. For most clients both are true, one after the other. ez Home Search tracks that activity rather than guessing, so a partner reaches the person on whatever side is moving right now.

This is also why reaching people early matters so much. A person dreams, then gathers information about what homes cost and what their own home is worth, then plans the financing and the timing, and only then acts. That path is often private and can run for months or years. Because every person on ez Home Search has one vetted local partner and an automated valuation model (AVM) tracking their equity, the partner stays present through the early stretch and is already the trusted name when the person is ready. The buyer they help today becomes the listing they earn next, and the whole move stays with one agent.

How New Hampshire agents try to win business today, and where it breaks

Woman in business attire sits at a desk viewing New Hampshire real estate leads on a computer, with files, a tablet, and a map on the desk.

New Hampshire agents work hard for leads, and every method they use has a real use and a real ceiling. Shared buyer leads from legacy portals are the most common. They deliver contacts fast, which counts for something, but that same contact is resold to a handful of agents together, and in a market where Seacoast sellers field cash offers, a cold, over-shared lead rarely converts. The next move is usually an IDX website. A good site helps, yet it is a slow asset that shows the same listings as everyone else’s and falls out of date the moment the agent gets busy with clients, which is most of the time.

Disciplined agents still work cold calling, circle prospecting, and FSBO and expired farming, and those methods build real skill. The cost is time, and in New Hampshire’s scarce-inventory farms, where the same few owners get called by everyone, it is also compliance risk. The moment an agent picks up the phone or sends a text, the law files them under telemarketer, and proving consent becomes the caller’s job, not the recipient’s. Predictive-seller software promises to point at who will list next, and the scores can be a useful starting point, but a high score only flags a maybe, and the partner must still build the relationship that produces a listing. All-in-one CRMs and do-it-yourself content fill a need too, though each is one more system the agent has to run and pay for. Paid ads can produce a burst of leads, then go quiet the week the budget stops.

None of these is worthless, and ez Home Search is not a replacement for hard work. The difference is structural. Instead of buying shared names, an Exclusive County Partner owns a whole county on a consumer platform people already use and trust, and the connections arrive warm, from real activity, with the person’s search history attached. The intent signals land in whatever CRM the team already runs, so the agent calls the contact whose behavior shows they are close, while the interest is live. ezVerify.ai verifies that each person opted in, holds the recording that documents it, runs the number through a known-litigator database, and clears Do Not Call registrations before a single call goes out, so the riskiest stretch of prospecting is settled ahead of time.

What the Exclusive County Partnership delivers for a New Hampshire team

Tree-lined suburban street with detached houses, manicured lawns, and autumn foliage under a clear sky—the perfect setting for attracting New Hampshire real estate leads.

The Exclusive County Partnership puts one team, agent, or brokerage in sole command of a whole New Hampshire county, their brand across the consumer experience, and no rival partner working the same ground. The economics are deliberately plain. Leads belong to the partner, there is no per-lead fee, and no slice of the commission goes anywhere else. A busy month in Rockingham or the Lakes Region means a busy month for the partner, never a larger bill.

What makes those connections convert is the model behind them. A person who reaches an ez Home Search partner arrives warm. They came to a platform they trust, searched on their own terms, and showed real intent through real activity, so the partner meets someone who already knows the brand on the site. This is The Only Confidential Home Search in practice. It is the pillar ez Home Search stands on to deliver A Better Way To Discover Real Estate. A person can search, save, and watch a home’s value, and their contact details and budget are never sold off or blasted out to a long list of businesses they did not choose. Their information goes to one vetted local expert, and they know who that is. Privacy earns the trust, and the trust is what makes the relationship convert for the partner.

For a New Hampshire team, the largest return is often the database they already own. Most agents pour their effort into new business and leave past clients and sphere to go quiet, even when repeat and referral business is the cheapest work they will ever land. ez Home Search puts that database back to work, co-branded and done for the partner, with home-value updates, listing alerts, and market reports people actually open. Partners reactivate past clients, whether by repeat business or referral, running 2.5 to 5 times the market rate. Because New Hampshire owners hold their homes for years while equity keeps building, that reactivated base is the steadiest business a partner has.

Relocation is the New Hampshire pain ez Home Search was built to solve on both ends. Two moves show the pain. A Massachusetts buyer relocates to the Seacoast but keeps a Boston job. A longtime New Hampshire owner starts weighing a move to Maine or across the country. In the old pattern, the client drifts to a legacy portal and the local listing goes to a stranger. Since ez Home Search reaches every market in the country, that client keeps searching on the partner’s co-branded platform, and the searches they run in another market surface as an early signal. The partner reaches out before the listing is in play, wins the home they helped the client buy, and refers the far-end purchase for a fee. The relationship travels with the client through the move rather than stopping at the county border.

Compliance comes built in. ezVerify.ai confirms consent and stores the recording behind it, checks every number against a known-litigator database, filters out Do Not Call registrations, and rounds out each contact so the partner can see where the person stands in their move. Its job is documentation and screening, so it is best understood as proof of consent on every opportunity rather than a lead score. The conversion tools that turn interest into deals, the AVM widgets, home-value pages, open-house sign-in pages, and instant cash offers, are all built and already running as part of the platform, co-branded to the partner. There is nothing to assemble and nothing to maintain. The partner walks onto a platform that millions of people are already using, carrying their name, and it works from the first day, so their hours go to clients and closings.

Claiming a New Hampshire county before the next agent does

Only one partner holds a New Hampshire county, and that is the point. The position cannot be shared, so once a team holds Rockingham, Hillsborough, or a Lakes Region county, no other agent can claim that same co-branded ground. Many of the state’s counties are already spoken for, and more are claimed every month, so the honest move for an agent weighing this is to check whether their county is still open rather than assume it will be.

What a partner steps into is already built. The search, the valuations, the listing alerts, the home-value pages, and the follow-up all run on ez Home Search’s own national platform, wearing the partner’s brand, so there is no stack to assemble and no launch to wait on. It runs from the first day the county is theirs.

The scarcity that matters most is the recognized-name position, more than the software. New Hampshire runs on roughly two months of inventory, which means listings are won by the agent an owner already trusts, not the one who happens to call that week. The advantage that compounds is being the known name across a whole county, on the platform residents already use, and it is one a competitor cannot copy from the outside. The counties that are open will not stay open, so the first step is simply to find out whether yours is one of them.

The New Hampshire agent’s real choice

A woman points to a map on a table while explaining it to two men sitting beside her in a meeting room, strategizing effective ways to generate New Hampshire real estate leads.

Every New Hampshire agent picks one of three ways to grow, whether they name it or not. The first is to keep buying shared portal leads, the same cold names handed to a batch of agents at the same time, and to accept the conversion that comes with them. The second is to build the whole machine yourself: the IDX site, the data, the valuations, the content, the compliance, and then spend every week keeping it alive instead of selling. The third is to hold one New Hampshire county on a platform residents already trust and let it deliver warm, owned relationships on both sides of the move.

The middle path is the one most teams land on once they see the other two clearly. It is worth being honest about the trade. Exclusivity means one partner per county, so a county is either open or already claimed, and turning a warm relationship into a closing takes 30 to 60 days of real follow-up, not a weekend. That is the cost of connections that convert and clients who stay for years.

Weigh it against a single number. Partners reactivate past clients, whether by repeat business or referral, running 2.5 to 5 times the market rate, working from a database the agent already owns. In a state full of long-tenured, equity-rich owners, that is the difference between starting every year from scratch and growing from a base that compounds. Counties get claimed one by one, and each goes to a single agent. The first move is the smallest one: find out whether yours is still open.

Frequently asked questions

Where are Massachusetts buyers landing on the New Hampshire Seacoast, and how does an agent reach them before they connect with a portal agent?

Massachusetts buyers are concentrating on the Seacoast, in and around Portsmouth, Exeter, Hampton, Rye, and Dover, drawn by New Hampshire’s lack of income and sales tax while many keep Boston-area jobs about an hour south. To reach them first, an agent has to be present while they are still researching, months before they raise a hand. On a legacy portal, that early research becomes a lead someone else buys. On the partner’s co-branded ez Home Search experience, the same activity surfaces to that single local partner, who reaches out while the interest stays warm.

How do New Hampshire’s high property taxes, with no income or sales tax, change what a buyer can actually afford from Concord to New Castle?

New Hampshire has no state income tax and no general sales tax, but it funds services through some of the highest effective property taxes in the country, and the rate swings widely by town. A buyer comparing Concord, near $29 per $1,000 of assessed value, to a low-rate town like New Castle at about $5, is looking at very different monthly costs on the same price. ez Home Search’s property-tax data and automated valuation model fold that into the true cost of owning, so an agent can steer a buyer to the town where the all-in number actually works.

Which New Hampshire counties are gaining residents fastest, and where is the seller opportunity as Lakes Region and White Mountains owners turn over?

Carroll County, spanning the White Mountains and northern Lakes Region, has been the fastest-growing county in New Hampshire, with amenity towns like Moultonborough and Tuftonboro leading. The seller opportunity is the turnover underneath that growth: second-home owners trading up or cashing out, and long-tenured owners aging into a move. An agent who is the recognized name in those towns, tracking each owner’s equity, wins the listing when the owner is ready instead of losing it to whoever runs an ad that week.

How do you generate seller leads in Rockingham County when supply is under two months and the median tops $670,000?

You generate seller leads in a tight county like Rockingham by being present with owners long before they list, not by fighting over the few active listings everyone else is chasing. With inventory near two months and a median around $670,000, owners hold real equity and move on their own timeline. A co-branded home-value tool that keeps an owner watching their number, plus automated follow-up when their activity picks up, puts the partner in the conversation first. Shared portal leads arrive only after the owner has already raised a hand somewhere else.

What is the best way to capture second-home and waterfront buyers around Lake Winnipesaukee and the Lakes Region?

The best way to capture second-home and waterfront buyers around Lake Winnipesaukee is to reach them while they are dreaming, which is where most of them spend months. These buyers browse from out of the area, save homes, and watch the market long before they act. ez Home Search treats that dreamer as a real user rather than a lead that failed to convert, and the partner in Belknap or Carroll County stays in front of them with saved-search alerts until the right property appears.

How can a southern New Hampshire team stay in front of clients who commute to Boston but buy in New Hampshire for the tax advantage?

A southern New Hampshire team stays in front of Boston commuters by owning the county-level relationship on a platform those buyers already use for search and home values. The commuter who buys in Salem, Nashua, or the Seacoast for the tax advantage keeps checking their home’s value and the market around them for years. Because the partner’s brand sits on that experience, the team stays top of mind for the next move, the refinance question, and the referral, instead of losing the client to a portal.

Where are the affordable New Hampshire markets, like Coos, Sullivan, and the Monadnock Region, for buyers priced out of the southern tier?

The affordable markets sit along the western and northern edges of the state: Coos County in the North Country, Sullivan County, and the Monadnock Region around Keene. Rents and prices there run well below the southern tier, which is why buyers priced out near the Massachusetts border increasingly look north and west. For an agent, these counties hold owner bases worth being the known name in, with far less competition for that position than in the metros.

How do Upper Valley agents around Lebanon and Hanover reach relocating Dartmouth and medical-center buyers?

Upper Valley agents reach relocating Dartmouth and Dartmouth Health buyers by being the trusted local guide before those buyers ever arrive. People relocating for a job at the college or the medical center research the Lebanon and Hanover market from a distance, often for months. A co-branded search experience they can use from anywhere, paired with one local expert who answers their questions, puts the partner in the relationship early, ahead of any agent they might otherwise meet through a portal listing.

With New Hampshire’s owner base aging while younger out-of-state buyers arrive, how should an agent balance downsizer listings and first-time-buyer demand?

An agent balances both by working them as two ends of the same market rather than two separate campaigns. New Hampshire’s median age is among the oldest in the country, so downsizer listings are a steady source of inventory, while roughly 60% of recent in-migrants are between 18 and 44 and need homes to buy. ez Home Search reads each contact’s behavior, so the same partner can serve the downsizing seller and the arriving buyer, and often match one to the other inside their own county.

08.04.2026

How to Get Real Estate Leads in New Mexico: A County-by-County Playbook

A home in Santa Fe sells for around $550,000. A home in Las Cruces sells for about $291,000. That is the same state, the same month, and a quarter of a million dollars of daylight between them. If you are trying to generate New Mexico real estate leads with one playbook that runs from the Colorado line to the Texas border, that gap is the first sign of why it keeps underperforming.

New Mexico looks like a single market on a rate sheet and behaves like six. The New Mexico Association of REALTORS® put the statewide median at $355,000 in May 2026, up 1.0% year over year, with homes averaging 52 days on market and inventory rebuilding to 5,674 active listings. That one number is accurate and nearly useless for deciding where to spend your prospecting hours, because it averages a luxury second-home market, an oil-boom economy, a national-lab corridor, and a stretch of ranching counties into a figure that describes none of them.

This is a county-by-county read of where the leads are in New Mexico, which regions reward which tactics, and why the agents who win here stop renting cold names and start owning a market. If you want the short version, check whether your county is still open before someone else claims it. The long version is below.

Welcome to New Mexico, Land of Enchantment roadside sign in a high-desert setting
One state, and at least six real estate markets behind the sign.

Why one New Mexico playbook does not travel

The same tactics do not work statewide because the forces moving each region are different. A farming strategy built for the Albuquerque metro will starve in the northeast high plains, and a luxury referral approach tuned for Santa Fe means nothing to an oil-field family relocating to Hobbs. Before you pick lead sources, you have to see the whole board.

Adobe-style house with wooden beams, desert landscaping, and mountain backdrop at sunset—perfect for attracting New Mexico real estate leads; patio boasts seating, fire pit, and kiva fireplace.

New Mexico is carrying several trends at once, and they pull in different directions. Prices are steady and inventory is recovering rather than collapsing, which shifts negotiating power back toward buyers in much of the state. Regional price bands diverge by hundreds of thousands of dollars. The population is close to flat and aging, with migration that is real but small and, as you will see, easy to misread. Energy anchors the southeast: New Mexico crude output roughly doubled from 2019 to 2023 and oil and gas supplied about 20% of the state general fund, according to the Federal Reserve Bank of Dallas in 2024. Film production anchors part of the center, with Netflix committing to a roughly $2 billion expansion of its Albuquerque studios in June 2024 and statewide film and television spending up about 51% to more than $794 million since 2019. Advanced manufacturing anchors Sandoval County, where Intel runs a multi-billion-dollar chip fabrication investment in Rio Rancho, the fastest-growing city in the state. Federal science anchors the north-central corridor through Sandia and Los Alamos national laboratories, and New Mexico leads the nation in research and development as a share of its economy.

No single one of those is the New Mexico story. Together they are the reason a lead strategy has to be built region by region. Here is how the six regions break down, and what each one hands you.

New Mexico breaks into six regions, and each one hands an agent something different

New Mexico’s leads cluster into six regions, and each has its own price band and its own demand driver. Read them as six separate businesses that happen to share a state license.

The Central corridor and Albuquerque metro is the volume engine: Bernalillo County and the city of Albuquerque, Sandoval County and Rio Rancho, and Valencia County around Los Lunas. The Albuquerque home value sits near $360,000, and demand is fed by Intel’s Rio Rancho fabrication plant and the film industry. Rio Rancho grew about 7.7% from 2020 to 2024 while the city of Albuquerque dipped slightly, so the growth is moving to the edges of the metro.

Downtown Albuquerque, New Mexico skyline at dusk
The Albuquerque metro is New Mexico’s volume market, with the growth now moving out to Rio Rancho and the exurbs.

The north-central Rio Grande corridor is the high end: Santa Fe, Taos, Rio Arriba, and Los Alamos counties. Santa Fe’s median near $550,000 is driven by second-home and out-of-state buyers, with lab and tourism income underneath it. This is relationship and referral country, not volume country.

The northwest Four Corners region runs on energy transition: San Juan County and Farmington, McKinley County and Gallup, Cibola County and Grants, with a significant Navajo Nation footprint. The southeast Permian, known locally as Little Texas, is the oil economy: Lea County and Hobbs, Eddy County with Carlsbad and Artesia, Chaves County and Roswell, Curry County and Clovis. High wages and a chronic housing shortage define it. The southwest border region is the affordability play: Doña Ana County and Las Cruces, Grant County and Silver City, Luna County and Deming, with New Mexico State University and the Santa Teresa trade corridor driving demand. The northeast high plains, from San Miguel County and Las Vegas to Colfax County and Raton, is rural, ranch-based, and low-cost.

Table showing New Mexico regions, anchor counties/cities, and notes on market trends to help generate New Mexico real estate leads from home prices, growth rates, tourism, and energy sectors.

Region data drawn from the Federal Reserve Bank of Dallas (2024), the New Mexico Association of REALTORS® (2026), and county population estimates.

Where the people and the transactions concentrate in New Mexico

Most New Mexico transactions concentrate in four counties, and the rest of the state is lower-density opportunity for the agent who claims it. More than 60% of New Mexicans live in Bernalillo, Doña Ana, Santa Fe, and Sandoval counties, a share the Legislative Finance Committee and University of New Mexico demographers project to reach roughly 66% by 2040. That structural fact tells you where raw deal count lives and where margin lives, and they are not the same place.

The ten most populous counties carry the bulk of the state’s closings. Learn them cold, because the difference between farming Bernalillo and farming Harding is the difference between a volume business and a scarcity business.

Table listing the top 10 most populous counties in New Mexico for 2024—ideal for generating New Mexico real estate leads with rank, county name, population, and principal city.

County populations from Census 2024 estimates. The dense cores give you a high-volume farm; a scarce county gives you margin and a name that becomes synonymous with the market. The strongest agents run both plays at once, and the model later in this piece is built to let them.

In New Mexico, the buyer is usually the seller too

Most New Mexico agents work the listing side hard or buy cold buyer lists, and both moves miss the same fact: roughly four in five buyers are also sellers. The National Association of REALTORS® put the first-time buyer share of purchases at a record-low 21% nationally in its 2025 profile, with the median buyer age at 40. Read that the other way. Close to 79% of buyers already own a home, which means most of your buyers must sell, rent out, or have just sold the property they are leaving.

That reframes the whole lead question. There are really three people in this market. There is the first-time buyer, now a smaller slice than at almost any point on record. There is the dual-majority buyer who is selling one home to buy the next, the largest group by far. And there is the seller-only owner cashing out of a rental or an inherited property. Treat those as two separate markets, buyers over here and sellers over there, and you pay twice to reach one household and still miss the timing.

The agents who convert in New Mexico read behavior instead of guessing intent. They reach the person early, while a homeowner is still deciding whether this is the year, and they follow whichever side of the move goes live first. Income makes this discipline matter even more here: New Mexico’s median household income sits near $60,980 against a national figure closer to $80,610, per the Dallas Fed in 2024, so timing and trust decide more deals than a splashy budget does. State first-time programs help at the margin. Housing New Mexico structures its assistance around buyers who have not owned a home in the past three years, which in practice means many repeat buyers still qualify, though the agency does not publish a fixed assistance figure and I would not quote one. The point holds: one relationship, worked early, usually contains both a sale and a purchase.

New Mexico’s migration is real, small, and cuts both ways

New Mexico’s population is barely growing, and that is not the same as fewer deals. The state added roughly 0.3% to its population from 2020 to 2025. Net domestic migration ran about 10,500 people out over those five years, while international arrivals added about 30,500, and natural change turned slightly negative as deaths edged past births. International in-migration, which had been the state’s main source of growth, fell about 73% from 2024 to 2025, according to Census Bureau estimates reported that year and University of New Mexico projections.

Put those numbers against the base before you let them scare you or a client. New Mexico has roughly 2.1 million residents and well over 800,000 owner households. A five-year net domestic outflow near 10,500 people is a rounding error against that owner base and a minor factor next to ordinary turnover, the moves driven by jobs, divorce, growing families, downsizing, and death. Transactions come from turnover, not from the net migration line.

Movement also cuts both ways, and both ways are business. The people leaving are listings, and they are relocation and retention work if you stay in touch through the move. The people arriving are buyers: households coming into Santa Fe and Taos from California, Texas, and increasingly Colorado; scientists and contractors around the national labs; oil-field families moving toward the Permian. Anyone selling you a story about everyone fleeing New Mexico is selling a headline, not a market. A state with modest net out-migration still has a full, active market on both sides of every move, and the agent who works both sides of one household captures more of it.

The insider edge most agents miss: lasting remote demand in New Mexico’s affordable counties

The work-from-home trend the headlines keep calling dead is one of the most overlooked buying signals in New Mexico’s affordable and lifestyle counties. The “decline” story measures today against the lockdown peak of 2020, and that is the wrong yardstick. Set against pre-pandemic norms, remote work has leveled off at about three times its old rate and stayed there. The Bureau of Labor Statistics counted about 36.7 million Americans teleworking at least part of the time in Q4 2024, when the telework rate reached 23.4%, up from a year earlier. The Census Bureau’s Business Trends and Outlook Survey, covering roughly 150,000 firms, found close to a third of businesses with at least one employee working from home and projected essentially the same level five years out. These are national figures, and they describe a plateau, not a retreat.

Remote worker at a home office desk with a New Mexico desert view through the window
Remote and hybrid buyers want a dedicated home office and a view, and New Mexico’s affordable counties can deliver both.

Apply that to New Mexico geography and the opportunity gets specific. The counties positioned to capture this lasting remote demand are the affordable and scenic ones: Taos, Silver City in Grant County, Ruidoso and Cloudcroft in the Lincoln and Otero highlands, the Sandoval County exurbs beyond Rio Rancho, and the northeast high plains around Las Vegas. A remote knowledge worker earning a coastal salary can buy far more home in these markets than in the metro they left, and they tend to stay, because the job is not tied to a local employer that might relocate them.

For an agent, that changes what a buyer wants and what a listing should feature. Remote and hybrid buyers ask for a home office they can close off, a separate casita or accessory dwelling unit for a partner who also works from home, more square footage, and real broadband rather than a marketing promise of it. Sellers in these counties who stage and describe a home around those features reach a buyer pool their local competition has no idea is even in the market. This is the edge that does not show up in a portal’s lead feed, because it is about reading demand, not renting names.

New Mexico’s low, capped property taxes are a selling point most agents skip

New Mexico gives homeowners one of the lowest and most predictable property-tax bills in the country, and an agent who can explain that holds a real edge in a listing appointment. The effective residential property-tax rate runs under 1% of a home’s value. New Mexico’s Legislative Finance Committee measured it at about 0.8% for a median owner-occupied home in its 2024 brief, and Tax Foundation data cited by AARP in 2026 put it closer to 0.63%. The exact number depends on the method, and both figures sit well below the roughly 1.1% national average. A buyer weighing New Mexico against a higher-tax state can picture that gap, so it belongs in the conversation early.

Two rules in state law keep the bill low and steady, and both are worth knowing cold. First, a home is taxed on one-third of its assessed value, not the full value. Second, for a property the owner already holds, the assessed value can climb no more than 3% a year, so a longtime owner’s bill does not jump when the market runs hot. On top of those, New Mexico applies a statewide formula called yield control that caps how fast total residential property-tax revenue can grow. In 2023 that formula pulled county residential rates down by about 3.3 mills on average, roughly $152 million in tax that counties chose not to collect, according to the Legislative Finance Committee. (A mill is one dollar of tax per $1,000 of taxable value.) Together those rules give New Mexico one of the most predictable costs of ownership in the country.

Adobe-style single-story New Mexico home with flat roofs and mountain views
Low, capped property taxes make New Mexico an easy carrying-cost story to hand an out-of-state or fixed-income buyer.

The actual bill still varies widely from one county to the next, which is one more reason a single statewide pitch falls short. Tax Foundation figures reported by AARP show the median residential property-tax bill running from about $305 a year in Harding County to about $2,717 in Los Alamos County, with the statewide median near $1,470. For an out-of-state buyer comparing New Mexico to a higher-tax state, or a longtime owner on a fixed income deciding whether to stay put or downsize, that range is the kind of concrete detail that moves a decision. Pair it with a clear read on the owner’s equity, from a current automated valuation model, or AVM, and a home-value page, and a homeowner has a reason to call you well before they are ready to list.

Three New Mexico markets that reward an agent who owns the county

Three of New Mexico’s most active stories sit well outside the statewide average, and each one rewards the agent who owns that county rather than dabbling across several. These are the markets where local knowledge is the moat.

The first is Permian workforce housing in the southeast. Lea County around Hobbs and Lovington and Eddy County around Carlsbad and Artesia ride the oil economy that the Federal Reserve Bank of Dallas documented in 2024, with crude output roughly doubling from 2019 to 2023. The boom has produced a persistent shortage of both homes and rentals, and the communities that hear it most from the people on the ground are the ones struggling to house teachers, police, and nurses, not just rig crews. Demand is real and wages are high, and the cycle carries risk, so the agent who works this market plans for both the boom and the pullback rather than betting the whole business on one direction.

An oil pumpjack operates in a dry, desert landscape—typical for New Mexico real estate leads—with distant mountains, scattered tanks, and a white pickup truck under a partly cloudy sky.

The second is border trade around Santa Teresa in Doña Ana County, an engine most of the state never sees. The Santa Teresa port of entry is the sixth-largest land port on the US-Mexico border and contributes roughly $2 billion a year to the New Mexico economy, according to a New Mexico State University economic study cited by the Dallas Fed and the state Economic Development Department. Around 80 companies operate across four industrial parks there, anchored by manufacturers like Foxconn and a major Union Pacific intermodal yard, and New Mexico’s exports to the world jumped about 141% in 2024. Those are industrial paychecks feeding Las Cruces housing demand, and an agent who understands the trade corridor understands why that market keeps absorbing inventory.

The third is Ruidoso and Lincoln County, where disaster has reshaped the second-home market. After the South Fork and Salt fires in the summer of 2024 and a deadly Rio Ruidoso flood on July 8, 2025, the state launched its first home-buyout program, called Rio Safe. As reported by Source New Mexico and KANW in March 2026, Lincoln County secured about $21 million in state funds, with a roughly three-to-one federal match available through a US Natural Resources Conservation Service watershed program that could bring the total well past $180 million, to buy out around 400 of the highest-risk homes and convert the land to public open space. For an agent, that program changes which parcels are sellable, reshapes buyer expectations, and puts home insurance availability at the center of every Ruidoso conversation. The local expert who can speak to it with authority is the one who earns those listings.

How New Mexico agents get leads now, and where each method falls short

New Mexico agents get leads today through a familiar set of methods, and each one falls short in a way this spread-out, boom-and-bust market makes worse. None of these is worthless. The question is what each costs you in time, money, and ownership, and where a better model closes the gap.

Shared portal leads are the most common starting point, and the same cold name gets sold to several agents at once, then routed toward whoever pays the most. You are buying a race, not a relationship, and in a state where trust closes more deals than budget, that is an expensive way to start behind. An IDX website is a slower drain: it is a real asset, but it takes months or years to rank, and most solo agents cannot keep one fresh enough to compete, so it sits as a cost center while they chase leads elsewhere. Agents who cold call, run circle prospecting, or work FSBO and expired listings still produce business from all three, though each is time-heavy and carries real compliance risk under federal Do Not Call rules and the Telephone Consumer Protection Act. Predictive-seller tools and generic all-in-one CRM platforms hand you scores and dashboards, but a score is not a relationship, and a dashboard does not reach the seller before your competitor does. DIY content and paid ads can work, and in the Permian they swing hard with the oil price, so the month you most need leads is often the month your ad costs spike and your pipeline thins.

A different model changes the math entirely. ez Home Search reaches consumers through a confidential, intent-and-activity-driven model built around a Single Local Expert, so the connection that reaches you is warm and chosen rather than a shared cold name bidding against three other agents. Instead of buying the same lead everyone else bought, you become the one agent a ready consumer is matched with. That is a structural difference, not a better script, and it is the reason the rest of this playbook is about owning a market rather than renting names in it.

Counties and communities beyond the New Mexico metros

The margin outside New Mexico’s metros is real for the agent who names and owns a county, and the work rewards genuine local knowledge. Rural property here comes with questions that a metro agent often cannot answer: water rights and acequia access that travel with the land, wells and septic systems that need inspection and permitting, and adobe or off-grid construction that a national relocation agent has never evaluated. In Taos, Corrales, and the Rio Arriba villages, the agent who can walk a buyer through a ditch association or a shared well is the agent who keeps the deal together to closing. That expertise does not scale from a call center, which is exactly why owning one county beats chasing ten.

Table listing New Mexico counties, their principal towns, and other communities—ideal for generating New Mexico real estate leads. Counties include Lea, Eddy, Chaves, and more.

Communities verified against county and municipal references. Each of these county seats and towns is a farm an agent can own outright, and in markets this size, one recognized name can hold a county for years.

What the Exclusive County Partnership gives a New Mexico agent

ez Home Search gives one partner per county the ownership that a spread-out, cyclical market like New Mexico makes genuinely valuable. The core of the Exclusive County Partnership is simple and worth stating plainly: one partner per county, you own the leads, there is no charge per lead, and there is no commission split. In a state where a single name can come to define a market, exclusivity does more than sweeten the offer; it decides whether you build an asset or rent one.

The supporting pieces map directly onto the pains this playbook has walked through. For the cold-calling and compliance exposure that comes with working a thin, phone-heavy market, ezVerify.ai provides consent proof, call recording, known-litigator screening, Do Not Call suppression, and contact enrichment. It is a compliance and verification layer, not a lead score, and in a state where you are dialing across long distances to reach scattered prospects, that protection matters. For the long sales cycles that rural New Mexico produces, where a seller in the northeast high plains may take a year to decide, ezNurture keeps the follow-up alive and reactivates a database you already paid to build, so the relationship you started does not go cold while the owner makes up their mind.

The model also fits the two-sided nature of the market. The county exclusivity partners ez Home Search works with consistently describe the same advantage: because they own the county rather than sharing a lead pool, they can work relocation and retention on the people leaving and buyer demand on the people arriving as one book of business, in markets like the Albuquerque metro, the Permian, and the north-central corridor. Add the conversion tools a solo agent would never build or run alone, plus coaching and support, and the partnership turns a scattered, cyclical territory into a system. You stop being one of several agents chasing a Hobbs or a Las Cruces lead and become the recognized name that market already trusts. If you are wondering whether the county you want is still open, that is the question to ask now rather than after a competitor claims it.

The Only Confidential Home Search reaches New Mexico’s early buyers first

The out-of-state and second-home buyers moving into Santa Fe, Taos, and New Mexico’s lifestyle counties start their search privately, and ez Home Search reaches them there. Many of these buyers are researching for months before they will ever fill out a form, comparing a Colorado exit to a New Mexico entry, weighing a casita in Taos against a downsizing move in Santa Fe. The agent who reaches them at that early, private stage is the one who is there when the search goes active.

The Only Confidential Home Search exists to do exactly that, and it is how ez Home Search delivers on the promise behind its whole brand: A Better Way To Discover Real Estate. Framed positively, it means a consumer’s contact details and budget are not sold, resold, recycled, or broadcast to a long list of unknown businesses. The consumer is matched with a single vetted local expert who serves their area, so the relationship starts with trust instead of a bidding war for their attention. Privacy is no longer a niche preference, either. The companies that have made it mainstream, from Apple and DuckDuckGo to Brave, Proton, 1Password, and Bitwarden, have trained a generation of consumers to expect that their information stays theirs. New Mexico’s incoming buyers are part of that generation, and the agent who meets them with a confidential search rather than a lead form is the one they remember.

Your New Mexico county may already be taken

New Mexico has 33 counties, ez Home Search partners with one agent or brokerage in each, and many are already claimed. That is the part worth sitting with. This is not a program that signs every agent in a market and lets them fight over the same leads. It is one partner per county, and counties come off the board every month as partners lock them in.

The engine behind the partnership is built to run from day one, so you are not waiting on a website to mature or a farm to warm up. It plugs into the market you already work and starts routing confidential, chosen connections to you as the county’s single local expert. The only real question is whether the county you want is still open, because once it is claimed, it is claimed. If your market is one you intend to own, the time to check is before the person one town over does.

The decision in front of a New Mexico agent

The choice here comes down to three roads, and only one of them builds something you keep. The first is to keep buying shared cold leads that reset with every oil cycle and every ad-cost spike, paying again each month to reach names a handful of other agents are also calling. The second is to assemble the entire operation on your own, an IDX site, a CRM, a compliance stack, a content engine, and run it while you also sell, which is a full-time job on top of a full-time job. The third is to own your county with ez Home Search and let the system do the parts that do not need you.

The honest trade-off is worth naming, because this is not a lottery ticket. The exclusive model rewards consistent follow-up, and the partners who work it typically see it produce over a 30- to 60-day window of steady contact, not overnight. What you get for that patience is the strongest position available in this market: the one agent a ready consumer is matched with in your county, with the leads owned by you, no charge per lead, and no split, feeding warm connections that convert because they started with trust instead of a bidding war. That is the whole case in one line, and it is a better bet than renting names that reset every quarter.

If you want to know whether your New Mexico county is still open, check now. Ask before someone else in your market does, because in a one-partner-per-county model, the only wrong move is waiting.

Frequently asked questions

Where are the out-of-state buyers relocating to Santa Fe and Taos coming from, and how do agents reach them first?

Most of the out-of-state demand for Santa Fe and Taos comes from California and Texas, with a growing share now arriving from Colorado, drawn by the lifestyle, the light, and prices that still undercut the coasts. These buyers research privately for months before they contact anyone, often comparing a downsizing move against a second home. The agents who win them are the ones present at that early, private research stage rather than waiting for a form fill. A confidential search model that matches a buyer with one local expert, instead of selling their inquiry to several agents, is how you become the name they already trust when the search goes active.

Is the Permian Basin housing crunch in Hobbs and Carlsbad still creating agent demand, or has the oil cycle cooled it?

The Permian housing crunch is still generating real demand, because the shortage in Hobbs and Carlsbad is structural, not a one-year spike. New Mexico crude output roughly doubled from 2019 to 2023, per the Federal Reserve Bank of Dallas, and the housing supply in Lea and Eddy counties has never fully caught up, leaving communities scrambling to house not just oil workers but teachers, nurses, and first responders. The caution is the cycle: oil-linked markets swing, so the agent who works this region plans for the pullback as well as the boom rather than betting everything on continued expansion. The agent who owns the county, instead of renting leads that spike in cost when the market does, stays steady through both halves of the cycle.

How have the Ruidoso wildfire and flooding changed the Lincoln County second-home market and home insurance?

The 2024 South Fork and Salt fires and the deadly July 2025 flood have reshaped which Ruidoso properties are sellable and made insurance a central part of every deal. In March 2026, Source New Mexico and KANW reported that Lincoln County secured about $21 million in state funds, with a large federal match available through a Natural Resources Conservation Service watershed program, to buy out roughly 400 of the highest-risk homes and turn the land into public open space. For agents, that means some parcels are moving out of the market entirely, buyers now ask about flood risk and insurability before price, and the local expert who can speak to the buyout program and the insurance picture with authority is the one who earns the listings.

Why is there a quarter-million-dollar gap between Santa Fe and Las Cruces prices, and how should that change my lead strategy?

The gap exists because Santa Fe and Las Cruces are different economies wearing the same state flag. Santa Fe, near $550,000, runs on second-home demand, national-lab and tourism income, and out-of-state relocation, while Las Cruces, near $291,000, runs on a border-trade and university economy with a far more local, first-time and move-up buyer base. A referral-and-relationship strategy tuned for Santa Fe’s high end will not fit Las Cruces, and an affordability-driven approach built for Las Cruces leaves money on the table up north. The takeaway is to stop running one statewide playbook and instead own the region whose economy you actually understand.

How do water rights and acequias change how rural northern New Mexico homes get listed and sold?

Water rights and acequia access can make or break a rural sale in northern New Mexico, and they are the detail most out-of-area agents miss. In places like Taos, Corrales, and the Rio Arriba villages, water rights often travel with the land and are governed by centuries-old ditch associations, so a buyer needs to understand what conveys, what does not, and how the acequia is managed before they close. Add wells, septic systems, and adobe construction, and the due-diligence list is unlike anything in a metro transaction. The agent who can walk a buyer through all of it is the one who keeps the deal alive, which is exactly why deep local knowledge of one county beats shallow coverage of many.

With New Mexico’s population barely growing and international migration falling, where does deal volume actually come from?

Deal volume comes from turnover, not from the migration line, and that distinction is worth holding onto. New Mexico grew only about 0.3% from 2020 to 2025, and net domestic migration ran modestly negative, but against roughly 2.1 million residents and more than 800,000 owner households, ordinary moves driven by jobs, family changes, downsizing, and estates dwarf the net migration number. Because close to four in five buyers are also sellers, most of that volume is one household making a single move that contains both a sale and a purchase. The agents who capture it work both sides of that move early and stay in the relationship, rather than chasing a population trend that was never where the transactions came from.

08.03.2026

How to Get Real Estate Leads in New Jersey

Ask a room of New Jersey agents about lead generation and you will hear the same complaint: there is nothing to list. Then look at the record. New Jersey closed about 86,440 homes in 2025, and even 2023, the slowest year of the rate shock, still cleared 84,305. The pandemic-era boom ran far higher, with single-family and condo sales alone topping 120,000 in 2021, until mortgage rates climbed and froze most owners in place. What agents read as scarcity is that lock-in at work, and the transactions are still there for whoever goes after them.

You can see the lock-in in three numbers. The average New Jersey owner is sitting on a mortgage near 4%, only about two months’ worth of homes are for sale at any given time, and the ones that do list sell fast. That is a supply problem, not a demand problem. Tens of thousands of homes still change hands every year, and somebody lists every one of them.

New Jersey is also several markets running at once. North Jersey, Central Jersey, the Shore, South Jersey, and the Skylands each run on a different engine, and they reward different plays. The agents who grow here work the volume the complainers walk right past instead of waiting for inventory to loosen.

The New Jersey housing market, trend by trend, and what each one means for agents

A woman in business attire works at a desk using a laptop and smartphone, both displaying a website titled “New Jersey Sellers” as she researches New Jersey real estate leads. A notebook and pen are also on the desk.

New Jersey is really several markets at once, and a handful of forces are pushing them in different directions. Start with sales volume, because that is where the gap between the complaint and the reality is widest. About 86,440 homes closed statewide in 2025. The rate-shock low of 2023 still cleared 84,305, and the 2020 and 2021 boom ran far higher, with single-family and condo sales alone topping 120,000 in 2021. Read together, those numbers mark a reset from an unusual high, not a market that fell apart.

Prices kept climbing while supply stayed tight. The statewide median across all property types reached $525,000 in 2025, up 5.4% year over year, according to New Jersey Realtors. Single-family homes ran to a $585,000 median, up 6.4%; condos and townhomes to $422,000; the 55-plus adult communities to $370,000. Homes sold at about 101.5% of list, single-family closer to 102.2%, and the typical listing went under contract in roughly 39 days. Two months of supply is a real seller’s market, and it held all year.

The rate lock-in explains why listings feel scarce. The average existing New Jersey owner holds a mortgage near 4%, market analyst Jeff Otteau has noted in coverage of the state, after rates peaked around 7.8%. That is a strong reason to stay put rather than sell and re-borrow at a higher cost. Single-family inventory fell about 7.3% year over year. Fewer owners list, the ones who do sell fast, and the transactions keep coming. The market feels tight and stays busy at the same time.

Affordability bites hard, and fewer New Jersey families own their homes than in most states. A large share of households put more than 30% of their income toward housing, and the state’s homeownership rate sits around 63%, on Census figures: 64.2% in 2022, 62.9% in 2024, and about 63.7% in 2025, below the national mid-60s. That wide renter base is a pipeline of future first-time buyers, people who need years of steady guidance before they ever sign, and the agent who shows up early is the one they call.

Job growth nearly stalled in 2025, and different industries moved in opposite directions. New Jersey added only about 5,100 jobs across 2025 while unemployment rose to 5.2%, on state Department of Labor data. Private education and health services carried the year with roughly 29,000 new positions. Trade, transportation and warehousing shed about 5,600, manufacturing 4,800, and professional and business services another 4,800. Layoff announcements ran high on top of that, roughly 16,000 for the year and the most since 2020, with WARN filings from Verizon at 1,319 positions, Anheuser-Busch in Newark, and Intercept Pharmaceuticals in Morristown among them, as tracked by researchers at Rutgers. Those are gross announcements, not net losses, and payrolls still grew. For an agent, that kind of churn is movement, and movement is transactions.

Household growth is concentrated in a few places. New Jersey added about 260,000 residents from 2020 to 2025, close to 3%, on Census estimates. Ocean County led every county in the state, up 36,418 residents, or 5.7%, since 2020, with Lakewood the fastest-growing municipality on a wave of young families. Growth like that clusters buyers into a handful of towns, and concentration is exactly what a single local expert can own.

New-business formation is still running hot. Application filings across the Northeast, New Jersey included, remain well above their pre-2020 levels, on Census Business Formation Statistics. Every new solo shop and small firm is a household that now wants a home office and a little more room, and that demand shows up first in the state’s more affordable counties.

Put those six trends together and the takeaway is simple. New Jersey is busy, expensive, and uneven, and an agent who works it as one market will misread most of it.

The tight-inventory story hides how much New Jersey actually sells

Bar chart shows top New Jersey real estate leads sources for NJ agents; pie chart shows marketing budget split, with online ads and content marketing as top categories.

The most expensive mistake a New Jersey agent makes is believing the no-inventory story and working a smaller market than the one in front of them. Even in its slowest recent year, 2023, the state still closed 84,305 homes. The trouble is crowding: most agents chase the same visible listings while the far larger pool of owners who are ready to move, though they have not raised a hand yet, goes unworked.

Competition is part of it. New Jersey is one of the densest states in the country, and its commuter metros around New York and Philadelphia carry more agents per available listing than almost anywhere. When everyone chases the same handful of new listings, the economics on those leads collapse, and the agent who paid the most to reach a seller usually meets four others who did the same.

The common answer is to build an owned asset, and an IDX website is a reasonable one. It is also slow. A new site takes months or years to rank, costs real money to keep current, and, for most agents, is not a place a past client ever returns to on their own. It waits for traffic that a search engine sends somewhere else.

Agents rent traffic instead, and that is where the shared lead comes in. A legacy portal collects a buyer’s or a seller’s details, sells that same name to several agents at once, then bills for it again the next month. The name arrives cold, with no history and no relationship behind it. In a market where the median home runs $525,000, paying again and again for a contact five other people also bought is a hard way to build a business. What an agent feels as scarcity is usually something else: the lack of a system that surfaces sellers before they raise a hand.

How New Jersey agents try to win today, and where each approach runs out

Woman in business attire sits at a desk, talking on the phone and writing on a form, with charts displayed on a large monitor and a tablet beside her as she manages New Jersey real estate leads.

Every New Jersey agent already runs some mix of six approaches, and each does one thing well before it stops short. The fastest way to see the gap they share is to name them plainly.

Shared portal leads deliver instant volume, which is their real appeal when inventory is thin. The catch is built in. The same contact is sold to several agents at once, arrives with no record of what the person actually wants, and costs the same whether or not it ever closes. In a $525,000 market, a cold name bought five ways is an expensive first hello.

An IDX website the agent builds and maintains gives them an owned asset, which matters. It is also slow to rank, costly to keep current, and rarely the place a past client comes back to, so it tends to produce a trickle rather than a stream.

Cold calling for-sale-by-owner and expired listings, and circle prospecting, still works for agents with the discipline to do it. It also runs straight into the TCPA and the Do Not Call registry, where the burden of proving consent sits on the caller, and it burns hours a busy agent does not have.

Predictive-seller tools score a database and flag who might list next. A score is useful, but a score is not a relationship. The agent still has to build the trust that turns a name at the top of a list into a signed listing, and the tool does none of that work.

Generic all-in-one CRMs organize contacts and automate reminders, which every team needs. What they do not do is generate consumer engagement or bring anyone back on their own. They manage the relationships an agent already has rather than creating the next one.

Do-it-yourself content and paid ads can build reach over time. Each is also another system to run and pay for, set apart from wherever clients actually spend their attention, and most agents cannot hold the quality up while also selling houses.

Put the six side by side and the same gap shows through all of them. None is a place a past client returns to on their own, and none reliably surfaces the seller before a competitor does. That is the specific problem worth solving, and it is worth checking whether your New Jersey county is still open before another agent solves it there first.

In New Jersey, the buyer is almost always the seller too

Most New Jersey lead strategies split one person into two campaigns, and that split costs them listings. The fix starts with a number. Nationally, first-time buyers fell to about 21% of purchases in the 2025 NAR Profile of Home Buyers and Sellers, a record low, with the median buyer now 40 years old. No clean New Jersey figure exists, so treat that national number as the anchor, and assume the state’s prices and taxes make it unlikely the local first-time share runs any higher. Roughly four in five New Jersey buyers already own a home they must sell before they can move into the next.

For that owner the sale and the purchase are a single move handled by one person, yet the standard playbook treats them as two people. An agent markets “list with me” to sellers on one track and buys cold buyer leads on another, and the four in five who are both fall through the seam between the two.

There are really three groups here, and they need different things. The first-timer, about one in five, has no home to sell and needs affordability, education, and confidence. The dual majority, about four in five, is trading up, down, or across, and needs the equity in the current home, the timing between the two sides, and the next purchase handled as one connected move. The seller-only owner, the estate or the exiting landlord, is the minority.

The whole trick is reading which side is live. On the platform behind ez Home Search, a valuation check or a visit to a home-value page signals that the seller conversation is open, while saved searches, opened alerts, and a booked tour signal that the buyer side is moving. For most people it is both, in sequence, and the technology follows the shift instead of guessing. It also reaches the person early, through the early months of dreaming, gathering information, and planning, well before they raise a hand on a listing. The agent who is already there when the move becomes real does not have to win the client. They already have them.

The seller conversation most New Jersey agents are not having

A woman shows property brochures to a man and woman in a kitchen, with a tablet displaying a house listing on the counter—an ideal setting for generating New Jersey real estate leads.

New Jersey gives agents three strong reasons to open a seller conversation this year, and the newest arrived in 2025. Each starts from a number, and each goes better when that number is honest.

Start with the automated valuation model, or AVM, an estimate of what a home is worth built from data rather than a hopeful guess. The common trap in a tight market is the agent who wins a listing by quoting the highest price, then spends two months walking the seller back down to what the home was always worth. A seller who begins with an accurate valuation, and a full comparative market analysis built on the same data that refreshes through the day, lists at a price that actually sells. On ez Home Search, an owner can follow that value month to month, which keeps the seller relationship warm through the years the lock-in keeps them in place.

Then there are the taxes, and New Jersey’s are the highest in the country. The average residential property-tax bill topped $10,000 for the first time, reaching $10,095 in 2024, and Essex County owners average closer to $14,000. A rising bill does more than annoy a homeowner. It caps what a buyer will pay, because the buyer shoulders that tax bill along with the mortgage, so prices adjust to make room for it. That makes the tax line a real reason an owner weighs selling, and an opening most agents never work.

The third reason is brand new. In a 2025 change, New Jersey’s “mansion” fee on home sales over $1 million became a graduated rate and shifted from the buyer to the seller. For contracts signed on or after July 10, 2025, the seller pays 1% from $1 million to $2 million, then 2%, 2.5%, 3%, and 3.5% at $3.5 million and above, according to New Jersey Realtors and legal guidance on the amendment. Any owner selling a million-dollar home in Bergen, Monmouth, Hudson, or along the Shore now needs real net-proceeds math before listing, not after. That is exactly the conversation a single vetted local expert, working from the AVM and a current market read, is built to have.

Put the valuation, the tax picture, and the new fee together and a New Jersey owner has three concrete reasons to talk to an agent this year. The listing-alert newsletters and home-value updates that carry the agent’s own brand keep those reasons in front of the owner month after month, so the agent is the name in mind when the owner finally moves.

Two-story brick colonial home in a New Jersey suburb framed by autumn trees
A classic New Jersey colonial. The seller conversation starts with an accurate valuation, not a hopeful guess.

Where New Jersey’s regions pull apart

A lead strategy that works in Hoboken can fall flat in Vineland, because New Jersey’s regions run on different engines. The table reads the state as six of them, each with the force that drives it.

Region (counties)What drives it
Gateway / North Jersey (Bergen, Hudson, Essex, Passaic, Union)The densest and priciest core, built around the New York commute, with the highest property taxes in the state; Jersey City and Hoboken lead the condo and townhome tier.
Central Jersey (Middlesex, Somerset, Mercer)The Princeton and Route 1 life-sciences and research corridor, feeding steady professional-buyer demand around New Brunswick and Edison.
Jersey Shore (Monmouth, Ocean)Primary homes, second homes, and 55-plus communities; Ocean County is the fastest-growing county in the state, up 5.7% since 2020.
Southern Shore / Greater Atlantic City (Atlantic, Cape May)A tourism and seasonal economy; Cape May was the only county in the state to lose population from 2020 to 2025, which reads as a relocation and second-home market rather than a fading one.
South Jersey / Delaware River (Camden, Gloucester, Burlington, Salem)The more affordable Philadelphia-commuter side, with steadier prices than the north and a clear inland-versus-shore split.
Skylands / Northwest (Sussex, Warren, Hunterdon)A rural and exurban lakes-and-space market, the most affordable corner of North Jersey and a fit for space-seeking buyers.

North Jersey is where the density and the money concentrate, and where the tax bills bite hardest. It also holds the entry tier, because Jersey City and Hoboken carry the condo and townhome market for buyers priced out of a single-family home. Central Jersey runs on the Princeton and Route 1 corridor, where life-sciences and research employers keep a steady stream of professional buyers moving through New Brunswick and Edison. The Shore blends primary homes, second homes, and 55-plus communities, and it holds the state’s growth story in Ocean County.

South Jersey is the more affordable, Philadelphia-facing side, where prices move more slowly than in the north and the inland towns sell differently than the beach ones. The Skylands, up in the northwest, is the rural and exurban corner, the most affordable stretch of North Jersey and a natural fit for buyers chasing space.

The Southern Shore deserves a note, because it is the one region the headlines misread. Cape May was the only one of New Jersey’s 21 counties to lose population between 2020 and 2025, down about 1,900 residents, while the other 18 gained and Ocean led them all. On its face that looks like decline. In practice a second-home and retirement market like Cape May stays active as a relocation and listing market, full of owners weighing a sale and buyers arriving from somewhere else. Departures are listings. Arrivals are buyers. The agent who reads the county that way works both sides of a market a competitor already wrote off.

The Atlantic City boardwalk lined with shops beneath high-rise buildings on the New Jersey shore
The Atlantic City boardwalk. The Southern Shore trades as a second-home and relocation market rather than a fading one.

New Jersey county by county: where the people and the listings are

New Jersey packs more than nine million people into 21 counties, and the ten largest hold the bulk of the transactions. The table names them with their principal cities.

CountyApprox. populationPrincipal cities
Bergen962,000Hackensack, Teaneck, Fort Lee, Paramus
Middlesex871,000Edison, Woodbridge, New Brunswick, Perth Amboy
Essex863,000Newark, East Orange, Bloomfield, Montclair
Hudson718,000Jersey City, Hoboken, Bayonne, Union City
Ocean654,000Lakewood, Toms River, Jackson, Brick
Monmouth645,000Middletown, Long Branch, Freehold, Red Bank
Union579,000Elizabeth, Union, Plainfield, Westfield
Camden527,000Camden, Cherry Hill, Gloucester Township
Passaic521,000Paterson, Clifton, Passaic, Wayne
Morris515,000Parsippany-Troy Hills, Morristown, Dover

Population figures from the U.S. Census Bureau, 2024 American Community Survey.

Read the concentration and the strategy follows. The four North Jersey counties near the top, Bergen, Essex, Hudson, and Passaic, together with Union, are the densest and most competitive ground in the state, where brand recognition matters more than raw hustle because so many agents work the same towns. Middlesex anchors Central Jersey and the Route 1 job corridor. Ocean is the outlier and the opportunity, the fastest-growing county in the state, where household formation around Lakewood, Toms River, and Jackson is minting new buyers faster than anywhere else. Monmouth pairs the Shore with an affluent commuter base, and Camden carries South Jersey toward Philadelphia.

Beyond the ten, Burlington, Mercer, Somerset, Gloucester, and Atlantic each clear a quarter-million residents and move real volume of their own. The lesson for an agent choosing where to plant a flag is plain. The biggest county is not always the best territory, because the biggest county is also the most crowded.

The counties beyond the big metros still move real volume

New Jersey’s mid-size and rural counties are where an exclusive partner can own a market without fighting fifty agents for every listing. The ten counties in the table sit outside the biggest metros, and each still turns over real volume across a handful of real communities.

CountyCommunities
SomersetFranklin, Bridgewater, Somerville, Hillsborough
MercerTrenton, Princeton, Hamilton, Ewing
BurlingtonMount Holly, Marlton, Moorestown, Willingboro
GloucesterWoodbury, Washington Township, Deptford, Glassboro
AtlanticAtlantic City, Hamilton Township, Egg Harbor Township, Mays Landing
CumberlandVineland, Bridgeton, Millville
SussexNewton, Vernon, Sparta, Hopatcong
HunterdonFlemington, Clinton, Raritan Township, Lambertville
WarrenBelvidere, Phillipsburg, Hackettstown, Washington
Cape MayCape May Court House, Ocean City, Wildwood, Stone Harbor

The strategy point is the crowding. In Bergen or Essex, a new agent is one of thousands, and the cost to stand out is enormous. In Hunterdon, Warren, Sussex, or Cumberland, the same effort buys a recognized local name far faster, because fewer competitors are spending against you. Somerset and Mercer carry the Central Jersey professional base and the Princeton halo. Burlington and Gloucester ride the Philadelphia commute. Atlantic and Cape May run on the shore and the seasons. Each is a market where becoming the known name is a matter of a year or two rather than a decade, and where the volume is steady enough to build a business on.

If your county is one of these, the only question that matters is whether it is still open, because a single partner holds it. It is worth checking your county before a competitor does.

Historic riverfront homes along the Delaware River in Lambertville, New Jersey
Lambertville, on the Delaware River in Hunterdon County. The less-crowded counties are where an exclusive partner can own a market.

The remote-work edge most New Jersey agents miss

The trend the headlines keep calling dead is a lasting buying signal in New Jersey’s affordable counties, and most agents are not using it. The “remote work is declining” story measures today against the spring-2020 emergency peak instead of the far lower level that came before it. Look at the national numbers a different way and the picture is a plateau. Work from home has run near a quarter of the country’s paid workdays and stayed at that level since 2023. In late 2024 the Bureau of Labor Statistics put the count of Americans teleworking at least part of the time at 36.7 million, higher than a year earlier. A Census Bureau study of 150,000 firms found close to a third keeping at least one person on a home workday, with those employers projecting the same share half a decade out. The pullback everyone talks about already ran its course, back before 2023, and what is left is the steady baseline.

That national shift lands hardest in the parts of New Jersey with room and a lower price. A hybrid worker who commutes into New York or Philadelphia only a couple of days a week can trade a cramped, high-tax town for space in the Skylands, across Sussex, Warren, and Hunterdon, or in the more affordable South Jersey counties. The same lasting demand shows up in the state’s rising business formation, where every new solo firm is a household that now needs a place to work at home. Nationally, the USDA found rural counties reversed a decade of decline and gained about 974,000 net movers from 2020 to 2024, concentrated in working-age adults, which is exactly the buyer a smaller New Jersey county wants to attract.

For an agent, this turns into a client conversation. Remote and hybrid buyers now shop for specific features, and the agent who names them first wins the search. They want a dedicated or closable home office instead of a corner of the dining room. They want a separate structure or an accessory dwelling unit for a studio or a second earner. They want more square footage, and they want real broadband, which in the rural northwest is a make-or-break line worth checking before an offer. An agent who farms Hunterdon or Warren with listings framed around those features, on a platform that surfaces the buyers already searching for them, is working a steady tailwind most of the competition has written off as finished.

Aerial view of a New Jersey lakeside neighborhood surrounded by trees
Lake country in the Skylands. Space, quiet, and a shorter commute are exactly what hybrid buyers now search for.

When a New Jersey client relocates, the listing does not have to walk away

Every year a slice of New Jersey owners move out of state, and the agent who helped them buy usually learns about it only after the listing is gone. The flow is steady and modest. New Jersey has long run net domestic out-migration, historically around 53,000 residents a year through the 2010s, offset by international arrivals of roughly 32,000 a year, and by 2023 and 2024 the net turned positive again. Departures skew toward Pennsylvania, Florida, and the Carolinas. Set against a state of more than nine million people and a large, stable base of owners, that flow is ordinary churn, and it cuts both ways.

Here is how it usually goes wrong. A past client starts thinking about a move to another state, opens a legacy portal to see what their money buys there, and connects with a stranger attached to a listing in the new market. The home they still own in New Jersey, the listing the original agent earned, then lists with that new contact. The agent who spent years on the relationship finds out after it is gone.

National coverage changes the picture. Because ez Home Search covers the whole country on the partner’s own co-branded platform, a client planning a move searches the new market on the agent’s site rather than leaving for a portal. Those out-of-state searches show up early, a signal that the move is starting, and the agent can step in before the listing is in play, talk through selling the current home, and refer the client to a vetted agent in the new market for a referral fee. A relocating client stops being a silent, total loss and becomes two paydays: the local listing kept, and a referral earned. Even a professional caught in one of the year’s larger New Jersey layoffs, weighing a move for the next job, stays visible instead of vanishing.

What ez Home Search gives a New Jersey county partner

ez Home Search hands one agent, team, or brokerage an entire New Jersey county, co-branded across the consumer experience, with no competing partner working inside it. This is the Exclusive County Partnership. The partner owns the leads, pays no charge per lead, and gives up no share of the commission when a deal closes. In a market where a single portal name can cost a small fortune and still arrive shared five ways, that structure alone changes the math.

The leads convert because they arrive warm. A person who reaches a partner through ez Home Search already trusts the platform and arrives with a history the agent can read: the towns they searched, the price band they kept landing on, the valuation they ran, the tour they finally booked. The connection is confidential and routed to a single vetted local expert rather than sold to a crowd, so the first conversation opens on what the person came in wanting. The county exclusivity partners we work with consistently report that these connections tend to close on a timeline measured in the first 30 to 60 days, because the trust that usually takes weeks to build is already half there.

The larger win sits in a database the partner already controls. Most teams pour their effort into new names while their past clients and sphere go cold, which in a lock-in market is an expensive habit, since those owners are staying put for years and staying reachable. ez Home Search reactivates that database for the partner, co-branded and done for them, and our own data shows partners reactivate past clients, by repeat business and referral, at 2.5 to 5 times the market rate. An Essex County owner watching a $14,000 tax bill, an Ocean County family who bought near Lakewood two years ago, a Bergen owner now facing the new seller-paid fee on a million-dollar sale: each stays engaged with a home search and a value update that carries the agent’s name, so the agent is already there when the move becomes real.

Everything that turns that interest into a deal is built and run for the partner. The search, the listing alerts, the home-value pages, the automated follow-up through ezNurture: none of it is a system the agent has to assemble or keep alive. And the riskiest part of the job, the outreach, comes handled. ezVerify.ai confirms a person opted in, keeps the recording that documents it, checks each number against a known-litigator database, and suppresses Do Not Call numbers before the agent ever dials, which answers the TCPA exposure that makes cold calling so dangerous in the first place. ezVerify.ai is a consent-and-compliance tool, not a lead score. On top of the platform, ez Home Search puts real people to work on the partner’s results with weekly coaching and sales enablement, because the partnership only pays off when the partner does.

The confidential search behind the leads

New Jersey is a high-income, privacy-aware state, and the reason ez Home Search’s leads arrive warm is the same reason people trust the platform in the first place. That trust rests on what the company calls The Only Confidential Home Search, and it is how ez Home Search brings A Better Way To Discover Real Estate to life. A person can search, save, and compare homes without their contact details and budget being sold, recycled, or broadcast to a crowd of businesses they never chose. Instead of being passed to a dozen strangers, they are matched with a single vetted local expert, while the wider trusted network stays theirs to reach only when they choose to.

The privacy is the mechanism behind everything earlier in this article. Because people feel safe, they engage honestly and share what is really going on in their move, and that honest engagement is what makes their eventual connection to an agent convert. The privacy is what produces the warm lead.

New Jersey buyers already live this way in the rest of their digital lives. They have watched a single form turn into weeks of calls, and they have moved to the private option everywhere else. The most valuable companies in technology were built on the same bet: Apple made privacy a core promise, DuckDuckGo and Brave grew by refusing to track, and Proton, 1Password, and Bitwarden sell architecture where the company itself cannot read what a customer stores. ez Home Search brought that standard to real estate, and in this state it is exactly what the consumer, and the agent who serves them, want.

Securing your New Jersey county

Only one partner holds each New Jersey county, and the map fills in month by month. That is the whole point of the model and also its constraint. Many of the state’s 21 counties are already claimed, more are taken every month, and once a county is held, no competing agent can take the same co-branded position inside it, no matter how much they spend.

The upside for the partner who moves is that there is nothing to build. The platform millions of people already use carries their name from the first day, with nothing to assemble, no data to chase down, and no months of setup before the first lead arrives. An agent steps onto a running system, co-branded to them, and it works immediately across the county they hold.

Which county is open changes constantly, so the only way to know is to check. If your market is one you would want to own before a competitor does, the time to look is while it may still be available.

The decision a New Jersey agent actually faces

Strip away the noise and a New Jersey agent has just three ways to source business. The first is the status quo: keep renting cold, shared names from a legacy portal that resells the same person five ways and bills again the next month. It works just well enough to keep paying for, and it never compounds. The third is the opposite extreme: build the whole national data-and-marketing engine yourself, the search, the valuations, the follow-up, the compliance, which would cost millions and years and is out of reach for any single team. Between them sits the reasonable path: hold your county on a platform that already runs all of it, co-branded to you, for one predictable fee.

Price and fit are not the hard part here. The one thing that can keep you out is availability: one partner holds each county, and yours may already be taken. Whether the model pays off is not in question. The county exclusivity partners we work with reactivate their past clients, by repeat business and referral, at 2.5 to 5 times the market rate, on top of the new business the platform brings.

New Jersey has plenty of transactions. What it lacks is agents who work the whole market instead of fighting over the visible slice of it. Check whether your New Jersey county is still open, and find out what it means to be the only name on the home search your entire county already uses.

Frequently asked questions

With New Jersey inventory near two months of supply and most owners locked into sub-4% mortgages, how do agents surface listing opportunities?

By working the owners who are not yet on the market. Inventory is tight because owners are staying put, not because they have stopped moving, and life events, tax bills, and equity changes still push a steady share of them to sell every year. The agents who win those listings stay in front of past clients and their sphere with a home search and value updates the owner actually returns to, so they are the name in mind when the move becomes real. ez Home Search runs that reactivation for a county partner, co-branded and automated, which is how partners list homes their competitors never saw coming.

New Jersey homeowners who leave mostly head to Pennsylvania, Florida, and the Carolinas. How does an agent keep the listing on the home a relocating client is selling?

By seeing the move before it happens. When a past client searches Pennsylvania or Florida on the agent’s own co-branded ez Home Search platform rather than a legacy portal, those out-of-state searches show up as an early signal, and the agent can reach out before the current home is listed, win that listing, and refer the client to a vetted agent in the new market, earning a referral fee on the move. Without that national reach, the same client ends up connecting with a stranger on a portal, and the local listing is gone.

Average property-tax bills top $10,000 statewide and about $14,000 in Essex County. How can an agent turn tax-bill anxiety into seller conversations?

Make the tax line part of the pricing conversation. A rising bill caps what buyers will pay and is a real reason owners weigh selling, especially in high-tax North Jersey. An agent who pairs an accurate home valuation with a clear read of how taxes affect the sale gives the owner both a reason to act and a reason to trust the advice. On ez Home Search, the automated valuation model and the home-value pages keep that number in front of the owner month after month.

The 2025 mansion-tax change now charges New Jersey sellers on homes over $1 million. How should an agent handle a high-end listing in Bergen or Monmouth County?

By running the net-proceeds math up front. As of the 2025 change, the seller pays a graduated fee that starts at 1% over $1 million and rises to 3.5% above $3.5 million, so a luxury seller needs to know their true take-home before they list, not at closing. An agent who walks a Bergen or Monmouth seller through the valuation, the fee, and the timing is having a conversation most competitors do not yet know to start.

Ocean County is the fastest-growing county in New Jersey around Lakewood and Toms River. How do agents reach the young families driving that growth?

Get in early, and stay local. Ocean County added more residents than any county in the state from 2020 to 2025, and growth like that concentrates first-time and move-up buyers in a handful of towns. A county partner whose brand sits on the search those families already use builds recognition faster than any ad campaign, and ez Home Search reads their activity so the agent reaches them when they are actually ready to buy.

Do the lead sources that work in dense North Jersey also work in South Jersey and the Shore, or should agents work them differently?

Differently. North Jersey is a high-tax, high-competition commuter market where brand recognition wins; South Jersey is a more affordable Philadelphia-facing market; the Shore mixes primary homes, second homes, and 55-plus communities. The tactics that surface a Hoboken condo buyer are not the ones that reach a Cape May second-home buyer. The one thing that works everywhere is owning the county and serving whichever side of the move is live, which is what the Exclusive County Partnership is built to do.

New Jersey’s 55-plus adult-community market in Ocean and Monmouth counties is one of the few segments adding inventory. What is the best way for a team to serve those downsizers?

Treat the downsizer as a buyer and a seller at once, because they almost always are. The adult-community median sat around $370,000 in 2025 and listings there grew while the rest of the market tightened, so these owners are selling a longtime home and buying the next one in a single move. A team that handles both sides, with the equity math and the timing in one place, serves them far better than two separate agents, and ez Home Search keeps both sides on one record of activity.

How do agents in the Princeton and Route 1 corridor reach relocating professionals moving into Central Jersey?

Be visible before the relocation starts. The life-sciences and research employers along Route 1 bring a steady stream of professional buyers into Middlesex, Somerset, and Mercer counties, often from out of state and often before they have chosen an agent. A county partner whose brand is on the region’s home search, with the school, tax, and neighborhood detail those buyers need, becomes the local name they find first. ez Home Search surfaces that activity so the agent connects while the search is still live.

07.31.2026

How to Get More Real Estate Leads in Nevada

Real estate leads in Nevada do not come from one place, and the mix keeps shifting. A lead that closes fast in Las Vegas can sit cold in Reno. Across 2025 and into 2026, Las Vegas inventory climbed and homes took longer to sell, while Reno and the rest of Northern Nevada held firm on the back of new data-center and factory jobs (Las Vegas REALTORS; Sierra Nevada REALTORS). The county with the most people is not always the one with the most opportunity. A shared portal lead that ignores those differences is a cold name you overpaid for. The agents who win here work the map on purpose. They read whether a person is buying or selling, they own a county instead of renting names, and they reach people before a hand goes up. This piece maps where Nevada’s leads sit, region by region, and how to turn more of them into closings.

Why Nevada’s biggest counties aren’t always its best lead markets

Nevada’s largest county is not automatically where your strongest lead opportunity sits. Clark County, home to Las Vegas, holds more than two-thirds of the state’s people, but across 2025 and into 2026 its market cooled. The median price of an existing single-family home settled near $489,000, while the number of homes listed without an offer rose about 26% in a year, pushing supply toward five months (Las Vegas REALTORS). Buyers gained time to shop, and a cold shared lead closes worse in that kind of market than it did at the frenzy’s peak. The biggest pool of people is also the biggest pool of competing agents. Size cuts both ways.

Aerial view of the Las Vegas Strip in daytime, Southern Nevada
Clark County holds most of Nevada’s people, and its cooling market is changing how agents work Southern Nevada leads.

Growth is the second reason population alone misleads. Nevada added 53,104 residents in the year to July 2024, a 1.7% gain that ranked it the sixth fastest-growing state (US Census Bureau, via The Nevada Independent). Most of that came from people moving in from other states. Net domestic migration ran about 41,300 for the year, roughly 130,800 arrivals against 89,500 departures, with California the top source and the top destination in both directions (USAFacts, from Census flows). Migration is only one trend here. It also cuts both ways for an agent: every departure is a home that needs listing, and every arrival is a buyer who needs a guide.

Demand also has a floor that outlasts any single year. The Center for Business and Economic Research at UNLV projects Clark County to pass three million residents around 2045 and reach about 3.23 million by 2060, with the share of residents 65 and older rising from 16.5% to 24.3% over that span (UNLV CBER). Read as an agent, that is a widening base of owners who will eventually sell, downsize, or move closer to family. New businesses keep forming, too, with Nevada entering 2026 among the fastest-growing states for new business filings (Registered Agents Inc.). Affordability pushes the other way. The wage needed to afford a modest two-bedroom rental reached about $33 an hour statewide (National Low Income Housing Coalition), part of why demand keeps spreading to cheaper markets outside the metros.

Here is where Nevada’s people sit.

County2024 populationPrincipal city and communities
Clark2,329,548Las Vegas; Henderson, North Las Vegas, Paradise, Enterprise
Washoe497,200Reno; Sparks, Sun Valley
Lyon61,680Fernley; Yerington (seat), Dayton, Silver Springs
Carson City58,384Carson City (state capital)
Nye54,344Pahrump; Tonopah (seat), Beatty
Elko54,047Elko; Spring Creek, West Wendover, Carlin
Douglas49,623Minden (seat); Gardnerville, Stateline, Zephyr Cove
Churchill25,805Fallon; Stillwater
Humboldt17,289Winnemucca; Golconda, McDermitt
White Pine8,735Ely; McGill, Ruth

County populations from the 2024 American Community Survey via Nevada Demographics.

The table shows where the population is. It does not show where you can win. Clark and Washoe hold most of the residents. They also hold most of the competing agents. The smaller counties are where one agent can still become the name people call, and that is where the next sections point.

Where Nevada’s tech and mining growth is creating new buyers and sellers

Follow the payroll and you find the lead. Specific job engines are putting new buyers into Nevada markets now and will turn many of them into move-up sellers within a few years, so an agent who knows where those jobs are landing gets there first.

The clearest example runs along Interstate 80 in the north. The Tahoe-Reno Industrial Center in Storey County has become one of the country’s larger data-center hubs. Google has expanded there by about $400 million, Vantage is building a 224-megawatt campus, and Microsoft bought land in Fernley to anchor a 4,300-acre logistics and industrial park, with operators such as Switch, Novva, and EdgeCore adding more (Forbes). The power to run it is being built for the long haul. NV Energy’s Greenlink West line will carry 4,000 megawatts about 350 miles from Las Vegas to Yerington when it energizes around 2027, and Greenlink North will add roughly 210 miles across White Pine, Eureka, Lander, Churchill, and Lyon counties by about 2028, part of a program near $4.24 billion (The Nevada Independent; Utility Dive). Multi-billion-dollar transmission does not get built for a hiring spike that fades. Storey County has seen this before. Tesla opened its Gigafactory there in 2014 and pulled thousands of jobs into the region (Nevada GOED).

Rural Nevada runs on mining, and it anchors those markets the same way. At Thacker Pass in Humboldt County, the first phase is built to produce 40,000 tonnes a year of battery-grade lithium carbonate. Its roughly $3.2 billion in phase-one capital includes a $2.26 billion federal loan and General Motors’ 38% stake, and it is expected to bring about 300 permanent jobs near a $63,000 average when production begins around 2028 (Lithium Americas; US Department of Energy). Gold mining across Elko and Humboldt has paid steady wages for a generation. In a small county, a few hundred stable jobs move the housing market in a way no metro statistic captures. Watch the hiring.

The Carson Valley and the capital region trade on lifestyle instead of payroll, and the prices there tell a different story. Across the northern counties, Sierra Nevada REALTORS reported recent median prices near $645,000 in Douglas, $615,000 in Storey, $535,000 in Carson City, $580,000 in Washoe, $410,000 in Lyon, and $397,000 in Churchill. The higher-end valleys near Lake Tahoe softened over the year while the more affordable exurbs held or gained. Work each region for the client it produces.

Downtown Carson City, Nevada streetscape in autumn
Carson City and the surrounding Carson Valley sell on lifestyle, a different lead story than the metros or the mining north.
RegionCore countiesWhat to work
Southern Nevada / Las Vegas ValleyClarkA cooling, buyer-friendly market: more inventory, longer days on market (LVR)
Truckee Meadows / Northern NevadaWashoeTech and manufacturing hiring keeping demand firm (Forbes; Sierra Nevada REALTORS)
Carson Valley & capital regionCarson City, Douglas, LyonLifestyle demand, softer at the top, firmer in the affordable exurbs (Sierra Nevada REALTORS)
I-80 industrial & mining northElko, Humboldt, Lander, PershingGold and lithium payrolls against thin rural housing (GOED; Lithium Americas)
Central Nevada / Pahrump basinNye, Esmeralda, MineralLas Vegas spillover and an affordability draw around Pahrump
Eastern & rural NevadaWhite Pine, Lincoln, EurekaA lasting housing shortage limiting supply (UNR; Nevada Rural Housing)

The under-worked Nevada counties where one agent can own the market

Nevada’s growth exurbs and mining counties are where a single agent, team, or brokerage can still become the known local name, because competition is thin and no national portal covers them well. These are not empty places. They are markets with steady sales and few agents fighting over them.

The housing itself is tight, which raises the value of a local expert. A statewide study by University of Nevada, Reno Extension and Nevada Rural Housing looked at 59 rural communities and found only 11 affordable at the local median income. Owner cost burden, the share of owners spending more than 30% of income on housing, ran from about 5% in Eureka County to about 30% in Storey County (2025). Thin, aging supply and a shortage of workforce housing mean buyers need someone who knows which listings are worth seeing and which lots can be built on. In a market that small, being the agent who answers the phone and knows the ground is most of the job.

Work these counties by their communities.

CountyCommunities worth farming
LyonFernley, Dayton, Silver Springs, Yerington
NyePahrump, Tonopah, Amargosa Valley, Beatty
ElkoElko, Spring Creek, West Wendover, Carlin
DouglasMinden, Gardnerville, Stateline, Genoa
ChurchillFallon, Stillwater, Hazen
HumboldtWinnemucca, McDermitt, Golconda, Orovada
White PineEly, McGill, Ruth, Lund
LincolnPioche, Caliente, Panaca, Alamo
PershingLovelock, Imlay, Grass Valley
LanderBattle Mountain, Austin, Kingston
StoreyVirginia City, Gold Hill, Mark Twain, Lockwood

The math favors this. You can become the name people call in Fernley, Elko, or Pahrump far more easily, and for far less money, than you can outbid fifty agents for one Las Vegas ZIP code. A shared metro lead costs more each year and arrives split among competitors. A county you own delivers its leads to you alone.

If owning a Nevada county is the position you want, apply or contact the ez Home Search partner team and ask which ones are still open.

How remote work is creating buyers in Nevada’s small-county markets

Remote and hybrid work is a lasting source of buyer demand in Nevada’s affordable and lifestyle counties, and most agents write it off. They write it off because of a measurement mistake: comparing the present against the spring-2020 peak instead of the years before it. Measured against the pre-pandemic baseline, working from home has settled at a much higher level and stayed there.

The national numbers hold. The Bureau of Labor Statistics counted about 36.7 million Americans teleworking at least part of the time in its most recent full-year reading, a rate near 23% and higher than the prior reading. In the Census Bureau’s Business Trends and Outlook Survey, drawn from about 150,000 firms, employers expect roughly the same level of remote work five years out. The USDA Economic Research Service put the net gain for the country’s rural counties at about 974,000 movers between 2020 and 2024, most of them working-age adults. The people leaving expensive metros for cheaper places with the lifestyle they want are exactly the buyers Nevada’s small counties can win.

Those national facts land on specific Nevada ground. Carson Valley and the Nevada side of Lake Tahoe in Douglas County, Dayton, Fernley, and Silver Springs in Lyon County within reach of Reno, Pahrump in Nye County about an hour from Las Vegas, and Carson City itself are the affordable, lifestyle markets positioned to catch the shift. The state’s steady inflow from California, much of it people keeping a coastal salary while paying a Nevada mortgage, feeds the same demand.

For an agent, this turns into a client conversation. A remote buyer wants a room that closes for calls, an accessory dwelling unit (a casita or separate structure) for an office or an aging parent, more square footage than a downtown condo, and internet fast enough to hold a video meeting. The agent who knows which Dayton subdivisions have fiber, or which Gardnerville lots allow an ADU, is the one that buyer remembers.

Modern carriage-house accessory dwelling unit with white walls
Remote buyers ask for a closable office or an accessory dwelling unit, the kind of detail a local agent can answer lot by lot.

Why working only listings or only buyers costs Nevada agents half their deals

Most Nevada agents run two separate campaigns for what is usually one person. They market “list with me” to sellers on one track and buy cold buyer leads on another, and they pay twice to serve a single move. The math is against them. Nationally, first-time buyers now account for only about one in five purchases, a record low (National Association of REALTORS). That leaves roughly four in five buyers holding a home they must sell before they can move into the next one. Work only one side and you lose the other.

Three groups sit inside that number. The first-time buyer, about one in five, has no home to sell and needs affordability and confidence. The buyer-and-seller majority, about four in five, is trading up, down, or across, and needs the equity in the current home, the timing between the two sides, and the next purchase handled as one move. The seller-only owner, an estate, a landlord exiting, or someone moving into a rental, is the smaller group.

The advantage goes to the agent who reads which side is live. A valuation check or a visit to a home-value page means the seller conversation is open. Saved searches and a booked tour mean the buyer side is moving. For most people it is both, in sequence, and a platform that watches the behavior serves the right side at the right time.

This is why ez Home Search keeps both sides of a person in one place, and why the early stages matter. A move usually starts long before it looks like one. Someone checks a home’s value for months before saying anything, or plans around a life change well ahead of a call. People will not do that research on a site that turns one search into a week of cold calls. That protection is what ez Home Search calls The Only Confidential Home Search: contact details and budget are not sold or broadcast to a crowd, and the person is matched with one vetted Single Local Expert they control. That private, one-expert match is ez Home Search living up to the promise behind its name, A Better Way To Discover Real Estate.

The movement shows up in the data. Clark County School District enrollment has fallen while the state’s public charter schools have grown to about 15% of Nevada’s public-school students (Nevada Current; 8 News Now). Families changing schools are families weighing a move, and an agent who sees that behavior early reaches them before the sign goes in the yard.

How Nevada’s property-tax cap tells you who is about to sell

A woman in business attire sits at a desk with real estate documents, talking on the phone about Nevada real estate leads, while data dashboards display on a computer monitor in an office with a city view.

Nevada hands agents a seller signal most never use, and it repeats every time a home changes hands. The state caps the yearly increase in a property-tax bill at 3% for an owner-occupied primary residence under state law (NRS 361.4723), against a cap of up to 8% for other property such as second homes, rentals, and land. The catch is that the 3% cap does not carry over on a sale. When an owner records a sale, or a refinance with a new deed, the lower cap drops until they file the county assessor’s postcard again to restore it (Clark County Assessor; PropertyTaxRates.org). Every recent buyer and every refinancing owner has a reason to hear from a local agent who understands this.

That signal fits inside a larger seller story ez Home Search builds for a partner. It starts with an automated valuation model, or AVM, engineered to be the most accurate available, feeding home-value pages and monthly equity updates a past client will open. It adds listing-alert newsletters and life-event timing, so the agent is present when a job change or a growing family turns “someday” into “this spring.” The database stays warm without the agent inventing something to say each month.

Relocation is where the sized migration turns into money. About 89,500 people left Nevada in a single recent year (Census flows via USAFacts). Each one owned a home in the market they left. On a legacy portal, a client planning a move to Boise or Austin opens a new site, connects with a stranger there, and the local listing goes to that new contact. On a co-branded national platform, that same client runs the new-market search on the agent’s own tools, and that activity shows up as an early signal to reach out, win the listing at home, and refer the purchase for a fee. The move stops being a silent loss.

What shared leads, cold calling, and IDX sites cost Nevada agents

A man in business attire sits at a desk signing papers, with a laptop, framed photo, and window city view in the background, focused on generating Nevada real estate leads.

Every lead source Nevada agents use gives something of value, and every one carries a hidden cost. Shared portal leads bring reach, but the same name sells to several agents at once and arrives cold, and the economics get worse as Las Vegas cools and buyers slow down. An IDX website, the home-search feed agents embed on their own site (IDX stands for Internet Data Exchange), is a genuine asset, but it is slow to rank and a steady drain to maintain. Cold calling and dialers create volume, and they also create exposure. Under federal law, an agent cold-prospecting by phone or text counts as a telemarketer, so a single disputed number can carry statutory damages under the Telephone Consumer Protection Act (TCPA). Predictive-seller tools score a database, but a high score is only a guess, and a person still has to do the relationship work that turns that score into a listing. Generic all-in-one systems, do-it-yourself content, and paid ads each solve a slice, and none of them is a place a past client returns to on their own.

The pressure has climbed in Nevada specifically. Average total commission has moved up toward 5.7%, and the 2025 National Association of REALTORS settlement changed the rules: buyers now sign a written agreement before touring, and seller agents can no longer advertise buyer-agent commissions on the MLS (Clever Real Estate, via the Las Vegas Review-Journal). Agents have to prove buyer-side value up front, in a crowded field, while the cost of a cold client keeps rising. That is the squeeze shared leads put an agent in.

ez Home Search works from a different starting point. It connects an agent to a person through real activity and intent on a platform that person already trusts, instead of a name bought off a list. Because the connection is confidential and the local expert is one person, the buyer or seller arrives already knowing who they are working with, so the trust that usually takes weeks is half built before the first call. This is not instant. In practice these relationships come together across roughly 30 to 60 days of steady contact rather than a same-day transfer. That is the honest trade, and it is why the business that comes from it lasts.

What an Exclusive County Partnership gives a Nevada agent that portals can’t

A woman sits at a desk by a window, participating in a video call on a laptop with two people visible on the screen, discussing strategies to generate Nevada real estate leads.

An Exclusive County Partnership makes one agent, team, or brokerage the known real estate name across an entire Nevada county, with no competing partner inside it. There is one partner per county. The partner owns the leads, pays no charge per lead, and gives up no share of the commission at closing. A portal sells the same Las Vegas name to several agents; a county partner holds the territory alone.

Why those connections convert comes back to the model. The person the partner meets already trusts the platform, has shown genuine intent through activity, and was matched to them as the one vetted Single Local Expert for that area. The supporting pieces map onto Nevada’s pains. Database reactivation is the cheapest growth a Washoe or Clark County team owns, and ez Home Search runs it for them, co-branded, so past clients keep returning to a home search that carries the agent’s name. Relocation retention plugs the leak those 89,500 departures represent. The known county name matters as much in Elko or Humboldt, where a few hundred mining jobs move the market, as it does in a metro.

Compliance is handled where cold calling leaves an agent exposed. ezVerify.ai confirms a person opted in, keeps the recording that proves it, checks every number against a known-litigator database and the federal Do Not Call list before a call goes out, and fills in contact detail the agent would otherwise chase. It proves consent and screens risk, and it makes no claim to score which lead will close. The conversion tools, the AVM widgets, the home-value pages, and the open-house sign-in pages already run on the national platform, co-branded to the partner, with nothing to build or operate.

If a Nevada county interests you, this is the point to apply or contact the ez Home Search partner team and ask whether yours is still open.

How Nevada county exclusivity works, and why counties don’t stay open

Two professionals sit at a table in an office, discussing Nevada real estate leads displayed on a tablet, with notebooks and coffee cups in front of them.

Only one partner holds a Nevada county, so the supply is fixed and demand tends to run ahead of it. Many of Nevada’s counties are already spoken for, and additional ones get claimed as the months pass, which is why the honest first step is to check whether the one you want is still open. The model works the same across the map. It fits Clark and its Las Vegas submarkets, a growth county like Washoe or Lyon, and a rural county like Elko or Nye, because the known local name carries the same weight in a small market that it does in a large one.

What makes it workable is that the engine is already running. A partner steps onto a national platform that already draws millions of everyday searchers, brand in place, and it produces from day one. There is nothing to configure and no stack to keep alive. The scarcity is real, the setup is not a project, and the position only deepens once it is yours.

The Nevada lead decision: keep renting names or own your county

The real choice for a Nevada agent comes down to renting versus owning. One path holds steady with shared cold leads while the Las Vegas market cools and each one costs more and closes less. Another builds the whole stack alone, the data, the search, the valuations, the compliance, which no single team can afford, since the data sourcing alone runs into the millions. The path most partners choose sits between them: own your Nevada county, put your name on the search your future clients already use, and reactivate the database you have already earned.

This path has a trade-off. The model rewards the agent who works a relationship over 30 to 60 days rather than one chasing a same-day cold transfer, so it asks for patience in the first quarter in exchange for business that compounds after. Weigh it the way you would any allocation: what it returns in the first year, what it builds over the next three, and what it is worth once the county name is fully yours.

One proof point matters most. ez Home Search partners bring former clients back, through repeat business or a referral, at 2.5 to 5 times the market rate. That is the difference between renting attention and owning a market. To learn whether the county you want is still unclaimed, apply or contact the ez Home Search partner team before someone else does.

Frequently asked questions

Where are the best places to find real estate leads in Nevada outside the Las Vegas and Reno metros?

The strongest under-worked opportunities are in the growth exurbs and the mining and industrial counties, because competition is thin and the local expert is scarce. Lyon County towns like Fernley and Dayton sit within commuting reach of Reno, Pahrump anchors the Las Vegas exurb in Nye County, and Elko and Humboldt run on steady mining payrolls. A statewide study found only 11 of 59 rural communities affordable at the local median income (UNR Extension and Nevada Rural Housing), which points to tight supply and a clear edge for the agent who becomes the known county name.

How are the data-center and manufacturing job hubs in Storey and Lyon counties changing where Nevada buyer leads come from?

They create buyers first and move-up sellers a few years later. The Tahoe-Reno Industrial Center in Storey County and the logistics center anchored by Microsoft’s land in Fernley are pulling in workers who need housing within a reasonable commute, which feeds demand in Fernley, Dayton, Silver Springs, and across Washoe (Forbes). An agent positioned in those communities before the next hiring wave is the one those buyers find first.

Are Las Vegas real estate leads getting harder to convert as inventory rises and the market tilts toward buyers?

They convert more slowly, and the cold-lead economics have gotten tougher. With single-family listings up about 26% year over year and supply near five months (Las Vegas REALTORS), buyers take their time, so a shared lead bought cold and chased against several agents closes slowly. Warm connections built on intent and trust hold up far better in a patient market than names rented from a list.

How can a Reno or Sparks agent reach relocating California buyers before they choose an agent?

The key is catching the search early, on a platform the buyer trusts, before they raise a hand. California is the largest single source of people moving to Nevada (Census flows via USAFacts), and many are remote or hybrid workers keeping a coastal salary. On a co-branded national search, a Reno agent can see a California client exploring Washoe listings as an early signal and reach out, instead of waiting for a portal form that gets sold to several competitors.

How should an agent in the Carson Valley and Douglas County win seller listings now that the higher-end market has softened?

Lead with equity and timing, because these higher-end valleys have softened, with Douglas County’s median near $645,000 in recent reporting (Sierra Nevada REALTORS). Owners there want an honest read on value and the right moment to list. Monthly home-value updates, an accurate automated valuation model (AVM), and a local expert who can turn that into a full comparative market analysis (CMA) reach a Carson Valley seller far better than a cold call.

How do agents in rural Nevada counties like Elko or Humboldt generate leads when mining and lithium hiring drives demand?

Follow the payrolls and become the name the incoming workers hear first. The Thacker Pass lithium project in Humboldt County is built for about 300 permanent jobs near a $63,000 average, with production expected around 2028 (Lithium Americas; US Department of Energy), on top of long-standing gold mining across Elko. In markets this small, a stable payroll moves housing, and the agent who owns the county and stays visible wins both the arriving buyers and the sellers they become.

How can Nevada’s property-tax cap, which resets when a home sells, help an agent find sellers?

Nevada limits the yearly rise on an owner-occupied home’s tax bill to 3%, well under the cap on second homes, rentals, and land. The catch for owners is that the discount does not survive a sale or a new-deed refinance: it resets, and only filing the county assessor’s postcard brings it back (NRS 361.4723; Clark County Assessor). That reset is a clean, specific reason to contact recent buyers and refinancing owners, a group most agents never work, and the agent who explains it tends to be the one they call when it is time to sell.

What lead sources work in Pahrump and the other Las Vegas exurbs where affordability is pulling buyers?

The sources that reach people early work best, because affordability is pushing Las Vegas demand outward to Pahrump and similar markets where the statewide two-bedroom housing wage of about $33 an hour bites less (National Low Income Housing Coalition). An agent who farms the community, captures home-value and search activity, and owns the county so they are the known local name will out-produce a shared metro lead that treats Pahrump as an afterthought.

07.30.2026

Nebraska Real Estate Leads: A Smarter Way to Grow

Statewide averages make Nebraska look like one slow, flat housing market, and any agent buying Nebraska real estate leads off that picture is working the wrong problem. Prices across the state rose about 3.6% in the year through the fourth quarter of 2025, well ahead of the 1.8% national pace, yet homes in the metros sell against barely two months of inventory even as 43 of the state’s 93 counties lost population. Both of those things are true because Nebraska holds at least six distinct markets under that single statewide number, each with its own prices, its own buyers, and its own kind of scarce supply. The Omaha metro, Lincoln, the Tri-Cities along the I-80 corridor, the northeast, the Panhandle, and the Sandhills each move on their own schedule, and an agent who prices, farms, and spends off one state figure will be wrong in most of them. The place to start is simple: know which of the six you are standing in before you spend a dollar chasing leads in it.

What is actually happening across Nebraska right now

The honest read on Nebraska is a state that grows slowly, appreciates faster than the country, and pushes almost all of that growth into a few eastern metros while much of the rest of the map holds flat or thins out. The price data shows the appreciation plainly. The state’s FHFA House Price Index reached 541.90 in the fourth quarter of 2025, up from 523.27 a year earlier, about 3.6% against a national rate near 1.8%. That is steady mid-single-digit growth, with no boom and no bust in it.

The population numbers fill in the rest of the story. Nebraska crossed 2 million residents in the Census Bureau’s Vintage 2025 count, reaching an estimated 2,018,006, a gain of about 0.6%. Most of that increase came from international migration, which added 6,599 people in the year through mid-2025 even after slowing by roughly half from the year before. Domestic migration ran slightly negative at 366 people, an improvement from a loss of 1,498 the prior year and a rounding error against 2 million residents and a natural increase of 6,136 births over deaths. For an agent, the households that leave are listings and relocation-referral business, and the ones that arrive, mostly from abroad and from moves within the state, are buyers. Both sides of that ledger are active at once.

Almost all of the movement concentrates in the east. The eight-county Omaha metro passed 1,001,010 residents, topping a million for the first time, and the Lincoln metro reached 350,626. Those two metros are where most of the state’s transactions close, and where the shortage of homes to sell runs tightest.

A broad job base holds the whole picture up. Nebraska’s unemployment rate ran near 3.0% against 4.1% nationally, and it rests on no single employer: healthcare systems such as Nebraska Medicine and Bryan Health, finance and insurance names including Berkshire Hathaway and Mutual of Omaha, Offutt Air Force Base and US Strategic Command, Union Pacific’s logistics operation, Kawasaki’s manufacturing plant in Lincoln, and food processing across the state. Because a buyer’s income here rarely depends on one factory staying open, demand holds steadier than it does in a one-industry town.

One cost works against all of that strength. Nebraska’s property taxes rank among the highest in the country, and they shape every listing price and every affordability conversation in the state, which is why they earn a section of their own below.

The ten counties where most of this activity happens show how plural the state really is:

CountyPrincipal cityCounty population (2024 ACS)
DouglasOmaha590,736
LancasterLincoln326,696
SarpyBellevue (also Papillion, La Vista, Gretna)197,389
HallGrand Island62,536
BuffaloKearney50,579
DodgeFremont37,351
Scotts BluffScottsbluff (also Gering)35,843
MadisonNorfolk (county seat is Madison)35,532
PlatteColumbus34,716
LincolnNorth Platte33,802

Lincoln County, home to North Platte, is a separate place from the city of Lincoln in Lancaster County. The two are easy to confuse and worth keeping straight in any farm plan.

Nebraska state welcome sign along a rural highway lined with farm fields
Nebraska markets vary widely from the state line on in, which is why the statewide average hides more than it shows.

Why the Nebraska market is tighter than the flat-state headline suggests

The squeeze in Nebraska’s metros sits in existing homes rather than new construction, and that distinction changes what a lead budget should chase. In the Omaha area, existing-home supply sat around 2.1 months in September 2025 and dropped as low as 1.3 months in January 2025, according to Great Plains Regional MLS. Six months is the line between a buyer’s and a seller’s market, so the resale side is running at roughly a third of balanced. New construction carried about 6.1 months of supply over the same stretch, which means the homes buyers most want, existing homes in established neighborhoods, are exactly the ones running shortest.

How fast homes move confirms the shortage. Existing homes in the Omaha metro sold in about 18 days at 98.6% of list price, with a median close near $300,000 (Great Plains Regional MLS, September 2025). A market where homes clear in under three weeks and close within a point and a half of asking is not soft by any reading.

The shortage traces to a building gap that has run for years, not a single slow season. Douglas County needs roughly 3,700 new housing units a year to keep pace with its growth, yet the metro has cleared 3,000 permits only twice in a decade, in 2017 and 2021, reaching 3,371 in 2024 (City of Omaha 2025 Affordable Housing Report, corroborated by Census single-family permit data). Every year the region builds under that mark, the deficit compounds and lands squarely on the resale market. What does get built leans away from starter homes: of 16,143 residential permits from 2020 through 2024, about 41% were single-family and 53% multifamily, per the same Omaha report.

For anyone spending on leads, the math points one way. Buyer demand in the Omaha and Lincoln metros is plentiful and cheap to reach, while listings are the scarce asset. An agent who pours a budget into shared buyer leads is buying the abundant side of the market and starving on the side that actually pays, because there are never enough homes to show the buyers already in hand. The move that works in a supply-starved market is to own the seller relationship early, before a listing exists, so you are the name a homeowner already trusts when they finally decide to sell.

That is the argument for owning a county instead of renting cold names inside it. See whether your Nebraska county is still open.

Where Nebraska’s buyers and sellers actually are

A real estate agent shakes hands with a couple outside a suburban home with a “sold” sign, mountains visible in the background—an ideal moment for generating quality Nebraska real estate leads.

Demand in Nebraska concentrates in the eastern metros and along the I-80 corridor, while the western half of the state trades at a slower, steadier pace. The six regions rarely compete for the same buyer, so a lead plan works best when it matches the region an agent actually covers.

The Omaha metro anchors the eastern end and carries the most weight. It passed a million residents in 2024, lifted by international migration and by suburban expansion in Sarpy County, and its neighborhoods run the full range, from Dundee and Benson near the core to Elkhorn and Millard on the western edge. Lincoln is the second market and grows on a different base: state government, the University of Nebraska, healthcare, and Kawasaki’s manufacturing plant, with demand pushing outward from the Haymarket and Near South toward Waverly and Hickman.

Through the middle of the state, the market follows the I-80 corridor. Grand Island, Hastings, and Kearney, the Tri-Cities, are steady mid-size markets built on food processing, healthcare, and logistics, and they carry some of the lowest unemployment in the country. Farther northeast, around Norfolk, Columbus, and South Sioux City, manufacturing and meatpacking pull international migration into Dakota and Dodge counties. The western half trades on a slower clock. The Panhandle around Scottsbluff and Gering runs on irrigated agriculture, sugar beets, dry beans, and cattle, and it holds steady regional-hub demand even as thinly populated counties like Sioux lose ground. The Sandhills, cattle country covering roughly a quarter of the state, turn over rarely and off tiny population bases, where a county like Blaine can post the state’s fastest percentage growth on a handful of people.

Migration fits inside that regional picture and needs to be read at its real size. Nebraska’s net domestic migration came to a loss of 366 people in the latest estimate, small enough against 2 million residents that it moves no market on its own. What matters is who is moving and in which direction. A household leaving the state is two opportunities for an agent, a relocation referral and a listing on the home being sold here, while the arrivals, mostly international plus a steady flow of in-state movers, are buyers. That inflow lands hardest in Sarpy County, which grew 2.2% to lead every large county in the state on the strength of domestic in-movers into Bellevue, Papillion, La Vista, and Gretna. A net-outflow headline and the fastest-growing large county in Nebraska hold true at the same moment, which is exactly why a statewide figure is the wrong tool for deciding where to work.

RegionAnchor marketsWhat is driving it
Omaha metro (east)Omaha, Bellevue, Papillion, Gretna, ElkhornPassed 1 million residents in 2024; growth from international migration and suburban Sarpy expansion
Lincoln metro (southeast)Lincoln, Waverly, Hickman350,626 residents, up 1.2%; anchored by state government, the University, healthcare, and Kawasaki manufacturing
Central / Tri-Cities (I-80 corridor)Grand Island, Hastings, KearneyFood processing, healthcare, and I-80 logistics; steady mid-size markets with very low unemployment
NortheastNorfolk, Columbus, South Sioux CityManufacturing and meatpacking, plus international migration into Dakota and Dodge counties
Panhandle (west)Scottsbluff, Gering, SidneySugar beets, dry beans, and cattle; stable regional-hub demand even as Sioux County fell 4.5%
Sandhills / north-centralValentine, Broken Bow, OrdCattle ranching, 500,000-plus beef cattle in the region; sparse, tiny-base counties, some growing off small numbers (Blaine up 5.3%)
Aerial view of Lincoln, Nebraska, with red-brick buildings, tree-lined neighborhoods, and surrounding farmland
The eastern metros like Lincoln carry most of Nebraska’s transactions and its tightest supply of existing homes.

The Nebraska growth corridor most agents under-farm

The clearest signal of where Nebraska families are actually landing is school enrollment, and it points straight at western Omaha and Sarpy County. A population estimate only tells you a county grew; enrollment tells you that households with children, the ones who buy three- and four-bedroom homes and stay for a decade, picked a specific set of neighborhoods. In Nebraska that data draws a hard line through a handful of districts most agents drive right past.

Gretna Public Schools, in Sarpy County, enrolled 7,013 students in 2024-25, up by roughly 1,500 over five years, and district leaders have said publicly they expect enrollment could eventually double (Nebraska Department of Education; 3 News Now). Bennington, in northwest Douglas County, enrolled 4,381 and projects it will pass 6,000 by the end of the decade, and neighboring Elkhorn reached 11,653. Those figures put all three among the fastest-growing districts in the state, on the very ground where Sarpy County posted its 2.2% population gain.

Lay the enrollment map over the migration map and they point to one target: the Gretna, Papillion, Bennington, and Elkhorn corridor along the western and southwestern edge of the metro. New households are forming there faster than new construction can keep up, so a listing that reaches the market already has buyers waiting on it. A farm built on that corridor is a farm built where the demand is being created rather than where it used to sit.

The metro corridor is not the only ground worth owning. Nebraska’s mid-size counties hold real communities an agent can farm well beyond Omaha and Lincoln:

CountyCommunities
AdamsHastings, Juniata, Kenesaw, Ayr
DawsonLexington, Gothenburg, Cozad, Overton
DakotaDakota City, South Sioux City, Homer, Emerson
GageBeatrice, Wymore, Adams, Odell
SaundersWahoo, Ashland, Yutan, Ceresco
CassPlattsmouth, Louisville, Weeping Water, Elmwood
SewardSeward, Milford, Utica, Staplehurst
OtoeNebraska City, Syracuse, Unadilla, Talmage
SalineCrete, Wilber, Friend, Dorchester
WashingtonBlair, Fort Calhoun, Arlington, Kennard

How Nebraska’s property taxes change every pricing conversation

Nebraska’s property taxes are the fourth-highest in the country, which makes pricing a home here a tax conversation as much as a comparable-sales conversation. The effective rate on owner-occupied homes runs about 1.43 to 1.44%, against a national average near 0.91% (Tax Foundation). On a $300,000 home, that gap works out to roughly $1,600 a year in extra carrying cost, every year, and buyers price it in whether or not the seller does.

The bigger complication is how those bills have moved. Residential assessments across Nebraska rose about 50% from 2017 to 2023 while actual tax bills rose about 40% (Tax Foundation and Platte Institute), because a bill climbs on rising valuation even when the rate holds flat. That is how a homeowner can watch their taxes go up in a year with no rate increase at all. The Legislature answered with LB 34, a school-district property tax relief measure worth about $750 million in fiscal 2025 and roughly $4.9 billion over five years, which eases the pressure without taking it out of the pricing math.

For a seller, the starting number decides almost everything that follows. The common trap is hiring whichever agent quotes the highest price, then spending the next two months getting walked back down to what the home was always worth, with the most valuable early weeks on market already gone. The better path starts from a number the data supports. ez Home Search begins with an automated valuation model (AVM) built to be the most accurate available anywhere and layers in property-tax detail down to the county and ZIP code, so the seller sees both the price and the tax load a buyer will weigh against it. From there the Single Local Expert turns that AVM into a full comparative market analysis, separates the repairs that move the price from the ones that waste money, and gives an honest read on whether the moment favors listing now or waiting.

That same tax detail works for the buyer, who in Nebraska is usually the same person. Run through the AVM and an affordability calculator, the county and ZIP tax picture shows the true cost of owning a specific home instead of the number on the listing. A seller who prices with the tax burden in view and a buyer who offers with it in view are two halves of one honest transaction, working from the same data. In a state where the tax line sits this heavy, the agent who can explain it is the one who wins the listing.

Single-story Nebraska ranch home with a covered front porch and autumn landscaping
In a state with the fourth-highest property taxes, pricing a home like this one is a tax conversation as much as a comp conversation.

Most Nebraska agents work one side of a buyer who is also a seller

Most agents pick a side. They run a “list with me” campaign to sellers, or they buy cold buyer leads, and they treat the two halves of one move as if they were two different people. That choice costs them, because about four in five of the buyers they chase already own a home they have to sell before they can buy the next one.

The number that proves it is the first-time-buyer share. Nationally, first-time buyers fell to about 24% of purchases, roughly one in five and a record low (NAR). No clean Nebraska-specific figure surfaced in the research, so the national rate is the honest anchor, and the state’s relative affordability likely supports first-time activity at least that high. Read it the other way and the point is plain: about four in five buyers are also sellers, trading up, down, or across in a single move.

That splits the market into three groups, each served differently. First-time buyers, the one in five, have no home to sell and need affordability, education, and confidence. The dual majority, the four in five, need the equity from the home they are leaving, the timing between the two sides, and the next purchase handled as one move. Seller-only owners, an estate, a landlord exiting, someone moving in with family, are the true minority.

The edge comes from reading which side is live and serving that one first. A valuation check, an equity question, or a repeat visit to a home-value page means the seller conversation is open. Saved searches, alerts opened the day they arrive, and a booked tour mean the buyer side is moving. For most people the two run in sequence, and ez Home Search follows that movement rather than guessing at it, reaching the person early in the private dream, gather, and plan stages, well before they raise a hand for anyone else. The agent already in place when the move surfaces is the one who wins both sides of it.

The remote-work edge most Nebraska agents miss

Man wearing a headset sits at a desk, talking on the phone, writing notes, and viewing a financial dashboard on a laptop. A Nebraska state flag is visible in the top right corner, suggesting he may be working with Nebraska real estate leads.

The shift to remote and hybrid knowledge work that headlines keep calling dead has not reversed. Nationally, remote and hybrid work sits at roughly three times its pre-pandemic level, which makes it a live buying signal for Nebraska’s affordable mid-size and lifestyle counties. The decline story mostly rests on a measurement trick, holding the emergency peak of 2020 up against today instead of lining today up against the years that came before.

The national data has held steady rather than fallen. The Bureau of Labor Statistics put the number of Americans teleworking at least part of the time at 36.7 million in the fourth quarter of 2024, up from 32.5 million a year earlier, with the telework rate climbing to 23.4%. On the employer side, the Census Bureau’s Business Trends and Outlook Survey, which reached roughly 150,000 firms in the biggest business-side count of its kind, found companies projecting close to the same level of remote work five years out as they run today. Those employers are building around it rather than winding it down, and the pattern has held nationally since 2023.

What most agents miss is where that shift lands in Nebraska. Once a knowledge job no longer ties a household to a coastal metro, the state’s affordable mid-size markets turn into live options: Buffalo County around Kearney, Hall County around Grand Island, Madison County around Norfolk, and Platte County around Columbus, along with the Cass and Saunders County exurbs between Omaha and Lincoln and the recreation markets of the Panhandle. Nationally, the USDA found that rural counties reversed a decade of decline and gained about 974,000 net migrants from 2020 to 2024, concentrated in the working-age adults a remote job frees to move. Nebraska’s mid-size and lifestyle counties are set up to catch a share of that.

For an agent, that adds up to lasting demand in exactly the markets where existing inventory is already thin, the mix that moves prices and rewards whoever is the recognized local name. It also shifts what these buyers want in a home, and the agent who hears it early wins the conversation. A remote or hybrid buyer asks for a dedicated or closable home office, sometimes a separate structure or ADU for a second person working from home, more square footage to hold both, and rural broadband that can carry a full day of video calls. A Kearney or Norfolk agent who leads with those features, and who already holds the relationship before the search goes active, is the one who closes the remote buyer moving in.

Landscaped public garden with a domed pavilion and flowering beds in Lincoln, Nebraska
Space and lifestyle are what pull remote and hybrid buyers into Nebraska’s affordable mid-size markets.

How Nebraska agents try to win leads today, and where it breaks

Every common lead tactic in Nebraska works up to a point, and most of them hit the same wall in a market where listings, not buyers, are the scarce asset. Each one earns its place, and each one runs into a real limit.

Shared buyer leads from legacy portals are fast to switch on and fill a pipeline quickly. They are also cold, sold to several agents at once, and aimed at the abundant side of a metro market where the real shortage is homes to sell. A buyer you win but share with three competitors, in a market carrying two months of inventory, is the wrong thing to spend on.

An IDX website the agent builds and keeps up is an asset they own, which is the right instinct. The catch is that it ranks slowly, costs real money to feed with content, and sits years away from competing with the national sites for the searches that matter. Cold calling FSBOs and expired listings still turns up business, and it carries the compliance exposure most agents underestimate, because the law treats a prospecting call as telemarketing and puts the burden of proving consent on the caller. Predictive-seller software rates the names in a database and guesses which owners may be close to listing, yet a high score is not the same as a relationship, and the agent is still the one who has to build the trust that turns a guess into a signed listing. Generic all-in-one CRMs promise to hold it together and become one more system to configure and run. DIY newsletters and paid Google and Meta ads can both work, and both spike while the spend is on and fade when it stops.

Underneath all of them runs the same limit. Each one buys a moment of attention or a cold name, and none holds the relationship across the years a person actually moves through, from dreaming to gathering to planning to acting. The mechanism ez Home Search runs on closes exactly that gap: a confidential, relationship-first funnel that surfaces intent from real activity on a platform the consumer already trusts, rather than a cold name rented from a portal. A past client watching their home value, a dreamer saving homes in Elkhorn, a household running a second valuation in Gretna, all of that is visible, and the follow-up fires on the activity while the interest is still live. Where the other tactics chase whoever is shopping today, this funnel keeps the relationship through the quiet years before and after, which is where the listings actually come from.

What an Exclusive County Partnership gives a Nebraska team

A real estate agent stands with a tablet in a modern home as a couple looks out the large windows at a snowy mountain view, discussing promising Nebraska real estate leads and the opportunities available in this picturesque setting.

The Exclusive County Partnership hands one agent, team, or brokerage an entire Nebraska county, co-branded across the consumer experience, with no competing partner working inside it. One flat fee holds the whole thing together. There is no charge per lead and no share of the commission when a deal closes, so a strong month is a strong month for the partner and not a bigger invoice.

The territory is worth holding because of the kind of connection it produces. A person who comes to a partner by way of ez Home Search arrives as more than a cold name off a list. They chose a platform they trust, searched on their own terms, and showed real intent through real activity, so the relationship holds across years rather than weeks. That is the payoff of The Only Confidential Home Search: a person’s contact details and budget are never sold, recycled, or broadcast to a crowd of businesses they never chose. Because they can engage honestly, ez Home Search matches each of them to one vetted local expert instead of auctioning them to whoever paid the most to reach them. That is ez Home Search delivering on the idea at the heart of its brand, A Better Way To Discover Real Estate. That promise is also why the leads convert. Warm, chosen connections close at a rate shared cold names never reach.

For a Nebraska team, that engine goes to work on the pains this market actually creates, starting with the book of business the partner has already built. Most agents pour their energy into chasing new deals and let past clients and their sphere go quiet, so the most valuable asset they own sits idle. ez Home Search puts it back to work: past clients return to a co-branded search to track their home’s value and watch the market around them, and the follow-up fires on that real activity rather than a generic monthly blast. Put the database back in motion and reactivation runs at 2.5 to 5 times the market rate, whether the business comes back as a repeat deal or a referral. In a metro where listings are the scarce asset, a reactivated past client who is ready to sell is worth more than any cold buyer lead.

Relocation is the quiet loss the platform is built to catch. When a past client leaves Nebraska, and the state’s small net domestic outflow means a steady trickle do, the agent usually loses both the referral and the listing on the home being sold here, because the move was never visible. On a co-branded national platform, that client keeps searching the new market inside the agent’s own branded experience, and those searches show up early as a signal that a move is underway. The partner sees it, makes contact before the listing comes into play, talks through selling the Nebraska home, and keeps the listing they earned.

Recognition builds on top of all of it. NAR’s research finds that 81% of sellers contact only one agent before choosing, so the recognized name in a county has effectively won the client before any comparison even starts. The partnership carries the partner’s brand across the search, the alerts, and the home-value updates the county already uses, which builds that recognition faster than any single team could manage on its own.

Two supporting pieces close the loop. ezVerify.ai confirms every opportunity has opted in and keeps the recording that proves it. It checks each phone number against a known-litigator database, drops numbers on the Do Not Call registry, and fills in detail on the contact, taking the riskiest step in prospecting off the agent’s plate before the first dial, and it does all of that as proof of consent, not a lead score. Every conversion tool already runs on the national platform, co-branded to the partner, with nothing to configure and nothing to maintain: the AVM widget, the open-house sign-in behind a QR code, the home-value pages, and the instant cash offer.

If that is the position you want in your county, see whether it is still open.

Only one partner can hold each Nebraska county, and many are already taken

A single partner holds each Nebraska county, and once it is taken, it is closed to every other agent inside it. The state has 93 counties, a good share are already spoken for, and more are claimed every month, so the position an agent wants is not always open by the time they decide to ask. That scarcity is the point of exclusivity: it is worth holding because no competitor can buy the same co-branded ground, no matter how much they spend.

The model works the same in Douglas County as it does in a rural county of a few thousand households, because the recognized local name carries weight in a small market just as it does in a metro. The partner claims a county with no build-out, standing up no technology stack and waiting on no new website to climb the rankings; they step onto a platform millions of people already use, now carrying their own name, and it works from day one. The only thing left to settle is whether the county is still open.

The decision a Nebraska agent actually faces

The choice in Nebraska comes down to three ways to spend the next year of lead budget. The first is the status quo: keep buying shared, cold buyer leads and working them against a two-month supply of homes, which starves exactly where this market is tight. The second is to build all of it in-house, the data, the valuations, the confidential search, and the follow-up engine, a stack that runs into the millions of dollars and the years of engineering no single team can realistically assemble. The third sits between them: own your county and the confidential, relationship-first funnel that comes with it, for one flat fee, and let the platform millions already use carry your name.

The honest trade-off is time. A relationship-and-database engine compounds slowly at first and then faster, so on reactivation most partners see real momentum in the 30 to 60 day range, and it keeps building quarter over quarter as past clients re-engage and their referrals follow. An agent who needs a spike this week should buy ads. An agent building a business that grows every year should own the county.

If one number should decide it, this is the one: a partner’s past clients come back at 2.5 to 5 times the market rate, a level the open market rarely matches. That is business the agent already earned once, now returning at a multiple, on ground no competitor can hold beside them.

Only one partner holds each Nebraska county. The next step is a single question: check whether yours is still open.

Frequently asked questions

Why do Omaha and Lincoln home prices keep climbing while dozens of Nebraska counties are losing population?

Nebraska behaves like several markets at once, which is why both facts are true. Growth and the housing shortage concentrate in the eastern metros while population thins across many rural counties, and the two do not cancel out. Omaha and Lincoln keep appreciating because demand there outruns a tight supply of existing homes, roughly two months’ worth, even as 43 of the state’s 93 counties lost population. Prices track local supply and demand, not a statewide average. For an agent, the opportunity is defined by which county you stand in, and the metros where prices climb are also where listings are scarcest and most valuable to win.

How do Nebraska’s property taxes, now the fourth highest in the country, change what I should price a listing at?

They cap what a buyer can pay. With an effective rate around 1.43 to 1.44% against 0.91% nationally, a Nebraska buyer carries a heavier annual cost on top of the mortgage, and offers adjust downward to make room for it. A seller who prices to the sticker without accounting for the tax burden watches the home sit. ez Home Search keeps an accurate valuation and the county and ZIP tax detail together in one place, so you can price to a number the market will actually meet and walk the seller through why.

Which Sarpy County suburbs and western Omaha exurbs are growing fastest for an agent deciding where to farm?

Follow the school districts. Gretna, in Sarpy County, enrolled 7,013 students in 2024-25, and its leaders expect enrollment could eventually double. Bennington reached 4,381 and projects it will pass 6,000 by the end of the decade, while neighboring Elkhorn has reached 11,653. Together those districts trace the Gretna, Papillion, Bennington, and Elkhorn corridor along the western and southwestern edge of the metro, the same ground where Sarpy County posted the state’s fastest large-county growth. That corridor is where households with children are forming, and where a listing already has buyers waiting on it.

How can an agent in Grand Island, Kearney, or Hastings compete with larger Omaha and Lincoln teams for online buyers and sellers?

You do not win the Tri-Cities by outbidding the metro teams for ad impressions, and trying to is a losing fight. The edge in these markets is ownership, not spend. An Exclusive County Partnership makes one agent the co-branded name across the home search the county already uses, for one flat fee with no charge per lead, so a Kearney or Grand Island agent competes on being the recognized local expert instead of on advertising budget. In a market that runs on reputation and referrals, owning the county beats renting clicks.

Offutt Air Force Base rotates families out of the Bellevue and Papillion area on a set cycle. How do I hold the listing when a past client gets orders out of Nebraska?

Catch the move before it surfaces. An agent usually loses that listing by never seeing it coming. The household starts searching the next duty station on some other site, connects with an agent there, and mentions the Sarpy County home they still need to sell. That agent refers the listing to a local competitor of yours for a referral fee, and the home you helped the family buy ends up selling with someone else. On a co-branded national platform, that family keeps browsing the new base area inside your own branded experience, and the searches they run show up as an early signal. You make contact before the home hits the market, take the listing on the Bellevue or Papillion property yourself, and refer the family onward to a trusted agent at the new posting for a referral fee. The relationship travels with the move rather than ending at the state line.

Is there enough for-sale inventory in the Omaha and Lincoln metros to build a buyer-based business right now?

There are plenty of buyers; the constraint is homes to show them. Existing-home supply in the Omaha metro has run around two months and dipped as low as 1.3, well under the six months of a balanced market. A business built only on buyer leads will stall on the listing side, because there are not enough homes for the buyers you already have. The steadier move is to own the seller relationship early, so you are generating listings instead of fighting over the handful on the market. ez Home Search is built precisely to surface those seller conversations before a home is ever listed.

How do I generate seller leads in slower Panhandle and central Nebraska markets like Scottsbluff or North Platte?

In slower markets the game is patience and presence, not volume. Homeowners in Scottsbluff, Gering, or North Platte move less often, so the agent who wins the listing is the one already in front of them when the time finally comes, months or years out. That means keeping past clients and local owners engaged with something they actually use: a co-branded home search where they watch their home’s value and the regional market, with follow-up that fires when their activity shows interest. A reactivated database, which ez Home Search runs for the partner, produces steadier seller leads in a thin market than any cold-calling campaign, and without the compliance risk.

07.29.2026

Real estate leads in Montana: a county-by-county playbook for agents and teams

Montana real estate leads do not behave the same way in Bozeman as they do in Miles City, and the agents who treat the state as one market lose to the ones who read it region by region. The typical Montana home value climbed 66% in the four years through 2024, according to the state Department of Revenue, and then the run cooled unevenly: Missoula‘s median sale price slipped 2.2% to $550,000 in 2025, its first annual decline in 15 years, per the Missoula Organization of Realtors. Across Billings, Bozeman, Missoula, Kalispell, Great Falls, Helena and Butte, and across six distinct regions, the questions a buyer or seller is asking depend entirely on where they stand. Montana is really a set of distinct local markets, and the lead strategy that wins here starts by respecting that.

Rural Montana homestead with a red barn, open field, and mountains in the background
Montana’s opportunity runs from resort valleys to rural homesteads, and the lead strategy has to match the ground.

Montana is many local markets, not a single story

Montana’s housing market is broad and mid-shift, and reducing it to one headline is the fastest way to misread it. The four-year surge that pushed the state’s typical home value up 66% through 2024 has settled into slower, steadier appreciation, with the statewide median around $513,000 in 2026 and forecasts pointing to low-single-digit growth rather than another spike. That normalization looks different in every region, which is the whole point.

Migration is one thread in that picture, and it deserves to be sized honestly rather than sensationalized. Montana added roughly 7,100 residents between mid-2024 and mid-2025, with net migration of about 7,247, some 6,348 of them arriving from other states and just under 900 from abroad, while natural change ran slightly negative as deaths edged ahead of births. That is a fraction of a percent of a state of about 1.14 million people, and it sits far below the nearly 18,000 Montana gained at the 2021 peak. For an agent, the number cuts two ways: arrivals are buyers, and the residents leaving or moving within the state are listings. A market with slower in-migration is still a full market on both sides of the move.

Affordability, not migration, is what Montanans themselves name as the pressure point. A 2025 statewide poll found roughly three in four residents worried about affording housing over the next five years, a concern rooted in the gap between home prices that doubled the cost of ownership and incomes that rose far less. That anxiety is a usable signal for an agent, pointing to which conversations matter and where the affordable inventory sits.

The economy underneath all of this is more diversified than the “ranch and recreation” caricature suggests. Health care is the state’s largest and fastest-growing employment sector, real estate has been the single biggest share of Montana’s GDP for a decade at around 13%, and financial and professional services lead economic production while tourism keeps expanding. New business formation runs hot on top of that base, with roughly 4,800 startups recorded in 2024 and about 6,000 new businesses registered in January 2025 alone, according to the Montana Secretary of State. Each of those trends produces buyers and sellers with different needs, which is exactly why a one-size lead approach underperforms here.

The property-tax reset is rewriting Montana seller math

A 2025 property-tax reform that lands on 2026 bills splits Montana homeowners into two tax worlds, and it changes when and why people decide to sell. The reform creates a lower, tiered “homestead” rate for primary residents who live in their home at least seven months a year and for landlords who rent on long-term leases of a month or longer. Second homes and short-term rentals fall outside that exemption and pay a flat, higher rate, roughly 1.90% on a dwelling and 1.35% on land, according to Montana Free Press reporting and the Montana Department of Revenue.

The scale of the shift is what makes it a business event for agents rather than a footnote. State officials estimate that about 80% of Montana homeowners see a tax cut under the new structure, on the order of 18% over two years, while many second-home and short-term-rental owners face increases well above that. The enrollment deadline for the homestead exemption on 2026 bills falls on March 1, 2026, with homeowners who received the 2025 rebate automatically qualified going forward.

Most agents overlook the prospecting angle here. A tax change of this size, hitting two groups of owners in opposite directions, is a concrete and time-bound reason to start a conversation. A second-home owner near Big Sky who just watched their carrying cost jump has a concrete reason to weigh selling. A primary resident who cannot tell whether their bill went up or down is a listing conversation waiting to happen, because the honest answer often leads straight into “and here is what your home is worth now.” The agents who understand the homestead split can open doors that generic prospecting never reaches, and they can do it without a gimmick, just useful clarity at the moment an owner is paying attention.

Where Montana’s market is cooling and where it is catching up

The fastest-growing western Montana markets are cooling first, while central and eastern counties are still catching up, and that split should shape where an agent invests. In the west, Bozeman and surrounding Gallatin County remain the most expensive market in the state, with a median home value around $685,000 after a 77% four-year climb. A buyer needs about 182% of the area’s median income to afford that median, and the City of Bozeman counts more than 7,000 households at or below 60% of area median income against roughly 1,500 income-targeted units, with 100% of area median income for a family of four set at $109,000 in 2024. Missoula tells the cooling story most clearly: its median slipped to $550,000 in 2025 for the first annual drop in 15 years, and the local affordability index, where a reading of 100 means a typical income exactly covers the cost of a median home, improved to 65 for buyers putting five percent down, up from a low near 50 in 2022, as incomes rose and rates eased.

Aerial view of Missoula, Montana, with the Clark Fork River winding between tree-covered hills
Missoula’s 2025 median dip, its first in 15 years, is the clearest sign of a western market cooling from its peak.

Economists see the same divergence in the data. Derek Sheehan of the Bureau of Business and Economic Research at the University of Montana notes that most Montana home prices roughly doubled between 2017 and 2025, and that the places that grew fastest are now showing the clearest signs of cooling. A named subset, Jefferson, Granite, Stillwater and Ravalli counties, rose below the state’s average rate of gain over that stretch. Rents follow a similar regional pattern: Gallatin County was the only large county with declining rents, peaking near $2,100 a month in early 2025 before easing, while Cascade and Yellowstone counties held near $1,300 and kept climbing. In Yellowstone, the largest group of renters shifted from earning under $40,000 in 2021 to earning $40,000 to $80,000 by 2024, a sign of would-be buyers priced into longer renting.

Central and eastern Montana are moving in the other direction, catching up late but for real. State reappraisal data show Fergus County, around Lewistown, up 82% over four years to a $242,000 median, Custer County, around Miles City, up 44% to $194,000, and Lincoln County, around Libby, climbing from $177,000 to $324,000 across two cycles. Even Daniels County in the northeast corner flipped from an 8% decline to a 36% increase between cycles. For an agent, the lesson is that opportunity is not concentrated in the four glamour metros. The regions below diverge enough that each rewards a different play.

RegionAnchor counties and citiesWhat the data shows
Gallatin Valley and southwestGallatin (Bozeman, Belgrade, Big Sky), MadisonThe priciest market in the state; Bozeman’s median near $685,000 after a 77% four-year rise, affordability the tightest anywhere in Montana.
Flathead Valley and Glacier CountryFlathead (Kalispell, Whitefish, Columbia Falls)Roughly 95% four-year value growth to a $578,000 median, with resort and short-term-rental demand layered on top.
Western and MissoulaMissoula CountyUniversity-anchored; a 2025 median dip to $550,000, the first in 15 years, as the market tilts slightly toward buyers.
South-central and BillingsYellowstone (Billings), CarbonThe most affordable major metro, near $400,000; a health-care and energy hub and the trade center for eastern Montana.
Capital and historic southwestLewis and Clark (Helena), Deer Lodge (Anaconda), Granite (Philipsburg)Capital-area values up around 68% in four years; historically cheap southwest towns among the fastest risers, several more than doubling.
Eastern Montana, the Hi-Line and BakkenRichland (Sidney), Roosevelt, Fergus (Lewistown), Custer (Miles City), DanielsAn agriculture-and-oil economy where appreciation arrived late but real, with several counties posting 30% to 80% gains.

Most of Montana’s opportunity sits beyond the four expensive metros

Aerial view of an affordable small Montana town with brick buildings, a water tower, and mountains beyond
Beyond the four expensive metros, dozens of Montana counties and small towns are markets a single partner can own.

The bulk of Montana’s listing and buyer opportunity is spread across dozens of counties an agent can realistically own, not concentrated in the handful of pricey metros that dominate the headlines. Ten counties hold most of the state’s population, and each pairs a principal city with a distinct market, from Billings in Yellowstone County to Libby in Lincoln County. The table below is the starting map.

CountyPrincipal city or citiesPopulation
YellowstoneBillings168,957
GallatinBozeman (Belgrade, Big Sky)124,074
MissoulaMissoula120,672
FlatheadKalispell (Whitefish, Columbia Falls)110,695
CascadeGreat Falls84,606
Lewis and ClarkHelena73,464
RavalliHamilton (Stevensville)46,727
Silver BowButte35,785
LakePolson (Ronan)32,561
LincolnLibby (Eureka)21,175

Past those ten, the state opens into markets with their own rhythms. The Bitterroot Valley runs south from Missoula through Hamilton and Stevensville. Flathead Lake anchors Lake County around Polson and Ronan. Paradise Valley stretches south of Livingston toward Yellowstone’s north gate at Gardiner. The Hi-Line and the eastern plains carry a different economy entirely: Richland, Roosevelt and Fallon counties produced about 74% of the state’s oil in 2021, layered over cattle, wheat and pulse crops, per the Montana Economist. That eastern market is slower and more cyclical, the kind of place where farming a county for listings is a multi-year presence rather than a paid-lead spike. It is also the kind of place a single committed partner can come to own completely.

CountyCommunities
Ravalli (Bitterroot Valley)Hamilton, Stevensville, Darby, Corvallis
LakePolson, Ronan, St. Ignatius, Pablo
LincolnLibby, Eureka, Troy
ParkLivingston, Gardiner, Clyde Park
CarbonRed Lodge, Joliet, Bridger, Fromberg
MadisonEnnis, Virginia City, Twin Bridges, Sheridan
CusterMiles City, Ismay
FergusLewistown, Denton, Moore
RichlandSidney, Fairview, Savage
BeaverheadDillon, Lima, Wisdom

Montana’s resort and second-home market runs on its own engine

A Montana river valley at golden hour with a small village, wildflowers, and snow-capped mountains
Resort and second-home demand concentrates in a handful of scenic Montana counties, and the 2026 tax rules change the math there first.

Montana’s tourism counties operate on a different engine than the rest of the state, and the new tax rules plus the short-term-rental picture reshape how an agent works them. Research from the University of Montana’s Institute for Tourism and Recreation Research counted 12,808 short-term rentals across the state, amounting to about 2.4% of housing stock on average and 2.8% at peak season. That statewide figure hides how localized the pressure is: nearly half of those rentals sit in Gallatin and Flathead counties, according to the institute. Flathead County alone runs around six percent of its housing stock as short-term rentals, rising toward 7.5% in peak months, and led the state with close to 4,000 summer listings. Park County, pressed against Yellowstone’s north entrance, stands out most of all, with short-term rentals reaching 11.5% of housing stock at peak. Those are the institute’s figures, and they describe a market where a small number of counties carry an outsized share of the vacation-rental economy.

The buyers in these markets often arrive with money made somewhere else. In Big Sky and Whitefish, purchases are frequently funded by equity from a home sold in a coastal city or by investment returns, which means the agent is meeting a relocating or second-home buyer rather than a local move-up. The resort economy runs deep enough that the newly formed Big Mountain Resort Area District near Whitefish collected about $1.5 million in its first year of resort tax, per the Whitefish Pilot.

For an agent, two openings follow directly. Second-home and short-term-rental owners now face a materially higher tax bill under the 2026 rules, which gives the ones weighing a sale a concrete reason to act and the agent a reason to reach out. And the steady flow of out-of-state equity buyers is relocation business in the other direction, a chance to be the trusted local name before the buyer ever fills out a form on a legacy portal.

The buyer in Montana is usually the seller too

Most agents work one side of the move and lose the other, and in Montana that mistake is expensive. The common playbook is to chase listings with “list with me” marketing or to buy cold buyer leads, treating the two halves of a single move as if they were different people. The math says otherwise. First-time buyers have fallen to about one in five purchases nationally, near a record low, which means roughly four in five buyers already own a home they will sell to buy the next one. That person is a buyer and a seller in one move, not two separate customers.

Montana splits that reality across its regions. First-time buyers, priced out of Bozeman, Missoula and the Flathead, increasingly look toward Billings, Great Falls and the central and eastern counties, where medians in the $194,000 to $242,000 range still sit within reach. The dual majority, the four in five who are trading up, down or across, are most visible in the expensive west, where a purchase is funded by the equity in the home being sold. True seller-only situations, an estate, a landlord exiting, an owner moving in with family, are the minority everywhere.

The advantage goes to whoever can read which side of the move is live and serve it. A valuation check or a home-value page visit signals the seller conversation is open; saved searches and booked tours signal the buyer side is moving; for most people it is both, in sequence. ez Home Search is built to follow that shift instead of guessing, and to reach the person during the early, private stages of a move, when one spouse is quietly checking a home’s value months before the couple raises it out loud. That is what The Only Confidential Home Search means in practice: a place where someone can look without their contact details and budget being sold to a crowd of businesses they never picked. That confidentiality is ez Home Search making good on its umbrella promise, A Better Way To Discover Real Estate. The partner behind that experience becomes the name already in place when the person is finally ready to act on both sides of the move.

The remote-work edge most Montana agents miss

The remote-work trend that headlines keep calling dead is real, lasting, and a buying signal in exactly the Montana markets agents underrate. The “decline” framing compares the present against the emergency peak of spring 2020 instead of the pre-pandemic baseline. Measured correctly, remote and hybrid work has settled at roughly three times its pre-pandemic level, around 25% of all paid workdays in the United States, and has held there since 2023. The Bureau of Labor Statistics counted 36.7 million teleworkers in the fourth quarter of 2024, a telework rate of 23.4%, higher than a year earlier. In a survey of about 150,000 firms, the Census Bureau found employers projecting essentially the same remote levels five years out, which tells you this is structural, not a fad on its way out.

Hiker on a mountain trail above a turquoise alpine lake in Glacier National Park, Montana
The lifestyle that draws remote workers to Montana’s mountain counties is a lasting, and underrated, source of buyer demand.

That shift moves people, and it moves them toward places like Montana. The USDA’s Economic Research Service reports that rural counties added roughly 974,000 net migrants between 2020 and 2024, concentrated among working-age adults aged 25 to 44, the remote-work-eligible group, reversing more than a decade of rural decline. Montana’s own researchers see the same force locally: the Institute for Tourism and Recreation Research named amenity migration by remote workers as one of the drivers behind demand in the state’s outdoor-lifestyle counties. The national statistics stay national, but the geography they point to is Montana’s, and specifically its mid-size and rural counties rather than only the marquee metros.

For an agent, that is a usable edge. That lasting demand lands in the Bitterroot Valley, around Flathead Lake, in Paradise Valley and across the mid-size counties that never make the national roundups, and it brings buyers looking for particular features: a dedicated or closable home office, a separate structure or accessory dwelling unit for work, more room to spread out, and genuinely fast broadband. An agent who knows which listings check those boxes, and who is positioned in the counties where these buyers land, is having a conversation most of the competition does not even know to start. The trend is not reversing, and the counties it favors are still wide open. If you want to know whether your county is one of them, you can check your county with ez Home Search before someone else claims it.

How Montana agents try to win leads today

Woman with headset sits at a desk with dual monitors showing maps and data in a modern office with large windows and mountain views, expertly managing Montana real estate leads.
A man points out features of a modern home’s living area to a couple; large windows show mountains outside, perfect for those seeking Montana real estate leads.

Montana agents have real options for generating leads, and each one solves part of the problem while leaving a gap. Shared portal leads put names in front of an agent quickly, but they arrive cold, resold to several agents at once, and with no proof the person agreed to be contacted. A self-built IDX website gives a team its own front door, though it ages into a slow asset that demands constant upkeep and rarely ranks against national sites. Cold calling and circle prospecting still work for the disciplined, but they carry real compliance exposure and a low yield per hour. Predictive-seller tools score a database and guess who might list, yet a high score only points at a maybe, and someone still has to build the relationship that turns that guess into a signed listing. Generic all-in-one customer relationship management systems promise to hold it all together, and then become one more platform to configure and run. DIY content and paid ads can spike a pipeline, but the flow dries up the moment the spending stops.

The limits all trace back to the same place: legacy real estate portals and shared leads are built to sell the same person’s information to whoever pays, not to hand an agent a warm, chosen connection. That is the structural difference ez Home Search is built around. Rather than reselling cold names, ez Home Search runs a confidential, activity-driven model that watches real behavior, a valuation checked, a search picked back up, a tour booked, and connects the person to a single local partner when the intent is genuine. The lead is not shared, there is no charge per lead, and the connection is warm because the person chose to engage with a platform they trust. That is a different starting point than a name off a shared list, and it is the reason the conversations convert.

What ez Home Search’s Exclusive County Partnership gives a Montana partner

A man and woman sit at a desk and shake hands with another man holding a document, with a cityscape and Montana flag visible through the window behind them—symbolizing a successful connection in securing Montana real estate leads.

The Exclusive County Partnership is ez Home Search’s program, and ez Home Search is the only place an agent can get it. One agent, team, or brokerage holds an entire Montana county, co-branded across the consumer experience, with lead ownership, no charge per lead, and no commission split. Only one partner holds a county, so no competing agent operates inside that territory. Whether the county is Yellowstone around Billings, Gallatin around Bozeman, or a Hi-Line county where a committed agent can become the recognized name, the structure is the same: the partner owns the ground.

Why those leads convert comes back to the confidential, Single Local Expert model. A person connected through ez Home Search is not a cold name bought from a list; they arrive already trusting the platform and carrying a history the agent can read, the neighborhoods they searched, the price range they kept landing on, the valuation they ran twice. The trust that normally takes weeks to build is half there before the first call. In practice, partners tend to turn those warm connections into signed clients in 30 to 60 days rather than the long grind a cold list demands. That is the payoff of putting the consumer experience first, and it is what makes the partner more effective than any shared-lead source can.

The biggest and cheapest return, though, comes from the database a partner already holds. Most agents keep chasing new business while the past clients and sphere they already have grow cold, even though repeat and referral work is the cheapest business they will ever win. ez Home Search reactivates that database and keeps it warm, co-branded to the partner, through the same home search, value updates and listing alerts the partner’s clients already use. ez Home Search’s own data shows partners reactivating past clients, by repeat business or referral, at 2.5 to five times the market rate. In a state where owners still pack up and move past their local market every year, that reactivation also protects the listing an agent would otherwise lose: when a past client starts looking at a move out of state, their searches surface on the partner’s own co-branded platform as an early signal, so the agent can talk through selling the Montana home before that listing quietly goes to a stranger on a legacy portal.

Compliance is handled too, which matters more in a prospecting-heavy business than most agents fully understand. The moment an agent calls or texts a prospect, the law treats them as a telemarketer, and the burden of proving consent falls on the caller. ezVerify.ai removes that exposure from every opportunity ez Home Search sends: it confirms the person opted in, keeps a recording that proves it, screens the number against a known-litigator database, suppresses Do Not Call numbers, and enriches the contact with detail the agent would otherwise chase down. ezVerify.ai works as a compliance and consent layer rather than a predictive lead score, and it gives the partner documented proof that every outreach is safe to make. Layer on the conversion tools every partner gets without building or running them, a home-value page, an instant cash-offer tool, an open-house sign-in sheet, and an automated valuation model (AVM) widget, and the partner steps onto a platform that works from day one. Before weighing any of that further, the first move is to confirm whether your county is still open.

Why a Montana county is worth claiming now

Only one partner holds a Montana county, and the state’s counties are being claimed one at a time. The model puts a single agent, team or brokerage on the consumer experience across an entire county, and more territories are taken every month, which is why exclusivity tends to run ahead of what is available. The position works the same in a large metro like Yellowstone or Gallatin as it does in a rural Hi-Line county, because being the known local name counts for just as much in a small market as in a big one.

What makes it worth acting on rather than watching is that the engine is already built. A partner does not assemble a technology stack, source the data, or spend months configuring a system. They step onto a national platform millions of people already use, with their own brand on it, and it runs from the first day. The one open question is whether the county a partner wants is still available, and that answer changes month to month.

Claim your Montana county before another agent does

The agents who win Montana are not the ones buying the most shared leads; they are the ones who own their county and read the market region by region. Think of the choice in front of you as three paths. The first is to keep buying shared, cold leads that arrive resold and unproven, and to keep competing for the same names as every other agent in your market. The other extreme is to assemble the entire machine on your own, a national search platform, the data pipeline, the reactivation engine, the compliance layer, which no single team can realistically pull off. The middle path is the Exclusive County Partnership: total local ownership without building the machine behind it.

The honest trade-off is exactly that exclusivity. Only one partner can hold a county, which means the one you want may already be taken, and no amount of spending changes that once it is. The upside is the same coin: when it is yours, it is entirely yours, co-branded across the experience your county already uses, with the reactivation that turns your existing database into your most dependable source of business. Partners reactivate past clients at 2.5 to five times the market rate, and that number alone tends to settle the question for agents who have watched repeat and referral business slip away for years.

Montana’s markets are still mid-transition and moving at different speeds, and the reward goes to the agent positioned before the shift finishes playing out. Check your county with ez Home Search and find out whether the ground you want is still open.

Frequently asked questions

How does Montana’s 2026 second-home and short-term-rental tax change when Big Sky and Whitefish owners decide to sell?

The 2025 reform that lands on 2026 bills moves second homes and short-term rentals outside the homestead exemption, so they pay a flat, higher rate, roughly 1.90% on a dwelling, while primary residents and long-term landlords get a lower tiered rate. In resort markets like Big Sky and Whitefish, where a large share of homes are second properties or vacation rentals, that raises the carrying cost of holding and gives owners a fresh reason to weigh a sale. For an agent, it is a timely, specific opening for an advisory conversation, and the owners most affected are exactly the ones an exclusive county partner is positioned to reach first.

Where are buyers priced out of Bozeman actually looking now, and how do I reach them?

Buyers who cannot clear Bozeman’s roughly $685,000 median increasingly look toward Belgrade and Livingston nearby, and toward more affordable metros like Billings and Great Falls or the central and eastern counties where medians still run in the low $200,000s. To reach them, an agent has to be present where they search rather than wait for a form, because these buyers often explore quietly for months. A co-branded search experience that follows their activity across regions surfaces them when the intent is real, instead of competing for the same shared leads every other Gallatin Valley agent is buying.

Is it worth farming eastern Montana counties like Richland or Fergus for listings now that values have caught up?

Yes, and the appreciation data is the reason. Fergus County around Lewistown rose 82% over four years to a $242,000 median, and eastern counties that once posted flat or declining values have swung to solid gains. These are slower, agriculture-and-oil markets where a listing relationship is built over years of local presence, not bought in a campaign, which favors the committed agent. An Exclusive County Partnership fits that patience: it makes a single agent the known name across an entire county, so that presence compounds instead of resetting each time an ad budget runs dry.

How do I reach out-of-state buyers purchasing Flathead Valley or Big Sky homes with equity from other markets?

Many buyers in the Flathead Valley and Big Sky arrive with equity from a home sold in a coastal market or with investment returns, which means they are relocating buyers who start their search long before they land. Because ez Home Search covers the entire country, a buyer researching a Montana move can do it on a partner’s co-branded platform rather than a legacy portal, and their early searches surface as a signal. The agent becomes the trusted local name during the research stage, well ahead of the moment that buyer would otherwise connect with a stranger attached to a listing.

With Montana’s population growth slowing, is there still a listing opportunity or is the market shrinking?

The market is still full and active on both sides, even with slower growth. Montana added around 7,100 residents between mid-2024 and mid-2025, down from the 2021 peak but still positive, and net migration works two ways: arrivals are buyers, and the residents moving within or out of the state are listings. Slower in-migration does not shrink the owner base or stop the steady share of owners who relocate past their local market each year. The listing opportunity is there; it just rewards an agent who can spot both the buyer and the seller inside the same move.

What lead sources work in Billings, Montana’s most affordable major metro, versus high-priced Bozeman?

Billings, the most affordable major metro near $400,000, draws first-time and move-up buyers who need affordability tools and steady follow-up, while Bozeman’s near-$685,000 market is dominated by equity-funded moves and relocation buyers. The same underlying source works in both because it adapts to behavior rather than price point: ez Home Search reads whether the buyer or seller side is live for each person and serves that side. The difference is in the conversation, not the lead source, and an exclusive county partner running one platform across both markets can tune the message without stitching together separate tools.

How does the homestead exemption change the seller conversation with Montana homeowners unsure whether their taxes rose or fell?

The homestead exemption cuts taxes for about 80% of primary-resident homeowners, on the order of 18% over two years, while raising them on properties that do not qualify, and many owners genuinely do not know which side they landed on. That confusion is an opening. An agent who can clearly explain the homestead rules earns trust at the exact moment an owner is thinking about their home’s cost and value, and that clarity often leads naturally into what the home is worth now and whether the moment favors selling. The enrollment deadline of March 1, 2026 gives the conversation a concrete reason to happen sooner rather than later.

When a past client sells a Bozeman or Kalispell home to cash out and move on, how do I keep that Montana listing instead of losing it to an out-of-state agent?

You keep it by hearing about the move before the listing is ever in play. When a Montana owner starts planning a relocation, whether they are trading Gallatin Valley equity for a lower-cost state or following family east, they usually open a legacy portal to see what their budget buys in the new area, connect with a stranger there, and list their Montana home with that new contact, all before the original agent hears a word. On a co-branded ez Home Search platform, the same client does that new-market research on the agent’s own experience, and it shows up early as a signal the agent can act on. The agent steps in, handles the sale of the Montana home, and passes the client to a trusted agent in that new market for a referral fee, keeping the Montana listing and the relationship intact.

07.23.2026

Real estate leads in Michigan: how to win a market that isn’t one market

The lead strategy that fills a Grand Rapids team’s pipeline will starve an agent in Marquette, and both keep hearing the same worn story about the state: that everyone is leaving. Neither the strategy nor the story survives contact with the numbers. Real estate leads in Michigan come from at least six markets that behave nothing alike, and the state they sit inside just reached a record population of 10,140,459 in 2024, its highest ever, according to the Michigan Center for Data and Analytics, the office of the state demographer.

Michigan is also one of the most owner-heavy states in the country. Its homeownership rate is 73.2%, well above the national rate near 65% (Census American Community Survey, 2023). That means a very large base of homeowners who bought, will sell, and will buy again, spread across Metro Detroit, West Michigan and Grand Rapids, the Up North lake country, the Upper Peninsula, mid-Michigan around Lansing, and Ann Arbor. Each of those is a different lead problem. The agents who win here stop treating Michigan as one market and start owning a piece of it.

What is actually happening across Michigan’s housing markets

A man in a suit stands outside a house holding a “SOLD” sign, celebrating success with Michigan real estate leads. The house features a stone and siding exterior, a welcoming porch, and well-kept landscaping. The “ez” logo is in the bottom right corner.

Michigan is not one story, and the agents who understand its full breadth read demand more accurately than the ones chasing a single headline. Here is the honest picture across pricing, migration, jobs, and supply, and it is a picture of an active market on both sides.

On price and inventory, the state has run tight. Regional Realtor associations reported roughly two months of supply through 2024 against the five to six months considered balanced, with days on market in the low twenties (Southwestern Michigan Association of REALTORS, 2024). West Michigan is the sharpest example: the Grand Rapids market averaged about 1.3 months of supply in 2024 and saw sales rise around 6% even as national sales fell, a seller’s market bucking the national trend (Grand Valley State University Seidman Business Review, 2025; Crain’s Grand Rapids Business, 2024). The lakeshore led appreciation, with Ottawa County‘s median price up 8.2% to $395,000 in 2024 and Kent County up roughly 6.5% (West Michigan Lakeshore Association of REALTORS, 2024).

Detroit changed direction. The city reached 645,705 residents as of July 2024, its second straight year of growth, reversing seven decades of decline (City of Detroit and U.S. Census Bureau, 2024). Riverfront redevelopment and the reopening of Michigan Central Station are pulling investment into surrounding neighborhoods.

Migration is where the “everyone’s leaving” story falls apart. Michigan’s growth engine is now international arrivals: a record net gain of 67,608 people from abroad in 2023 to 2024, the highest since at least the 1990s, which carried the state to its population record (Michigan Center for Data and Analytics, Vintage 2024). Domestic migration was a net loss of 7,656 residents to other states over the same year, but that ranks only 41st nationally, and nine states, including Illinois, New York, and California, lost more. The far larger internal movement is Michiganders shifting toward smaller, amenity-rich counties: rural counties held 16.5% of the population in 2020 yet accounted for 40.8% of the state’s growth from 2020 to 2023 (Michigan Center for Data and Analytics, 2024).

Jobs run wider than the auto plants. The vehicle economy is large and in the middle of a transition: the state has drawn roughly $16.6 billion in electric-vehicle and battery investment, yet Ford scaled back its Marshall battery plant in 2024, and Stellantis issued 2025 layoff and federal WARN notices touching thousands of metro-Detroit workers (Bridge Michigan, 2024; Detroit News, 2024; WXYZ Detroit, 2025; Michigan Department of Labor and Economic Opportunity). Around that sit large, steadier employers: Corewell Health and Henry Ford Health, Stryker’s medical-device operation near Kalamazoo, the University of Michigan and Michigan State each above 50,000 students, an agriculture sector worth more than $104.7 billion a year (Michigan Department of Agriculture and Rural Development), and tourism that generated $54.8 billion in 2024 (Travel Michigan).

Automotive assembly line in a Michigan factory with robotic arms working on car bodies
Michigan’s auto economy is shifting toward electric vehicles and batteries, reshaping which regions gain and lose jobs.

Supply is the constraint underneath all of it. Michigan authorized roughly 19,000 to 20,000 residential permits a year from 2022 through 2024, rising to about 22,400 in 2025 (U.S. Census Bureau Building Permits Survey, compiled by the Michigan State Housing Development Authority). The state raised its housing goal to 115,000 built or rehabilitated homes by the end of fiscal 2026, and Kent County alone is projected to need about 33,900 additional units by 2030 (Housing Next, reported by Crain’s Grand Rapids Business and WOOD-TV). Two more facts shape the year: Michigan carries one of the country’s steepest seasonal price swings, roughly one-fifth from summer peak to winter trough, and mid-Michigan is the affordability release valve, where a typical local income can still afford a typical home (Greater Lansing’s housing affordability index sat above 100 in late 2024, the point at which the median household can afford the median-priced house) as buyers priced out of Grand Rapids look east.

That is a full, two-sided market. The question is which piece of it you own, and how you get in front of the buyers and sellers inside it before anyone else does.

Why lead generation is harder in Michigan than the playbooks admit

Three people sit at a cafe table with a laptop and documents, discussing Michigan real estate leads. A street scene is visible through the window behind them.

Lead generation is harder here because Michigan is crowded and divided, and most of the tools agents reach for were built for neither problem. The state has tens of thousands of active agents competing for attention, and a lead approach that works downstate rarely travels to the lakeshore or the Upper Peninsula. Look honestly at how agents try to solve it today, because each of these methods has a real use before it hits a limit.

Shared and portal leads are the default, and they do generate volume. The trouble is in how those leads are made. On the legacy real estate portals, a buyer’s or seller’s contact details and budget can be sold or routed to whoever pays the most, so the same lead often reaches several agents at once. You end up paying to compete for a name half a dozen other agents are already calling, and the bill arrives again next month whether or not last month’s leads closed. Your own IDX website answers the ownership problem, but it becomes a slow, depreciating asset that needs constant feeding to rank against national sites with far deeper data and faster refresh. Cold calling and paid search or social ads both work while you feed them time or money, and both stop the moment you do, which makes them a poor fit for Michigan’s long winter pipeline. Predictive-seller tools promise to name the next listing, yet a probability score buys no trust with the owner behind it, and the agent is left to build, from scratch, the rapport that turns that name into a signed contract. Generic do-everything CRMs and do-it-yourself content fill the gaps in theory and add two more systems to run in practice.

None of these is worthless. The problem is that they are aimed at the small slice of Michigan that is actively transacting this month, and they leave the agent rebuilding the pipeline from zero every time a campaign ends. In a state this seasonal and this regionally split, that reset is expensive. What holds up better is owning a defined territory, owning the leads that come from it, and being the name buyers and sellers there already recognize, which is a different model than renting attention by the click.

The Michigan property-tax edge most agents leave on the table

The fastest way to turn a Michigan lead into a client is to explain the one thing almost no one else does: how the state’s property-tax system actually treats a buyer at the moment of sale. None of it is fine print to a Michigan homeowner. These are the questions they already worry about, and the agent who can walk through them becomes the trusted local expert instead of one more voice asking for the listing.

Start with Proposal A and the “pop-up.” While one owner holds a home, its taxable value can rise each year only by the lesser of 5% or inflation. The cap is tight right now: the state’s 2026 inflation multiplier is just 1.027, or 2.7%. When the home sells, that cap comes off. The year after a transfer, the assessor resets taxable value to the property’s state equalized value, which is set at roughly half of market value, so a long-held home can carry a much higher tax bill for the new owner (Michigan Department of Treasury, “Changes in Ownership and Uncapping”; Michigan State Tax Commission, Transfer of Ownership Guidelines, under MCL 211.27a). The line every Michigan buyer needs and few agents deliver: the seller’s current tax bill is not what you will pay. An agent who runs that number before the offer protects the client and looks like the only professional in the room who understood the deal.

The Principal Residence Exemption is the next lever. A homeowner who lives in the property can claim it and skip up to 18 mills of local school operating tax. A mill is one dollar of tax for every thousand dollars of a home’s taxable value, so 18 mills comes to about $1,800 a year on a home taxed at $100,000, which is roughly a $200,000 house. A second home or an investment property gets no exemption and pays that full amount every year (Michigan Department of Treasury, Principal Residence Exemption guidelines, under MCL 211.7cc and 211.7dd). For the Up North buyer weighing a lake cottage, or the investor pricing a rental, that yearly gap belongs in the first conversation, and it is the kind of local knowledge that earns referrals in second-home and investment markets.

Two more numbers help an agent show a seller what they will actually walk away with. Michigan’s transfer tax, owed when a property changes hands, runs 0.75% at the state level plus about 0.11% at the county level. That works out to roughly $8.60 for every $1,000 of the sale price, and the seller customarily pays it, about $2,580 on a $300,000 home (Michigan Department of Treasury; Oakland County Register of Deeds, under MCL 207.526 and 207.505). The state’s individual income tax is a flat 4.25% for 2026 (Michigan Department of Treasury; Tax Foundation), a clean talking point for the out-of-state buyer comparing Michigan against higher-tax alternatives.

None of this converts a lead by itself. What it does is make the agent the person who answers the question the buyer or seller is actually asking, which is what a good lead platform should surface and route to you: the owner running a valuation, the buyer studying a neighborhood, the mover comparing states, delivered warm and already interested rather than sold to the highest bidder.

Not sure whether your county is still open? It takes a minute to check which Michigan county is available, and that answer decides everything else in this article. (Check your county and book a call.)

Winning seller and listing leads in Michigan

To win seller leads in Michigan, an agent has to reach owners early, with a credible estimate of what the home is worth and enough standing to be believed. Michigan makes that easier than most states, for the simple reason that it has so many owners to reach. With a 73.2% homeownership rate and roughly four million households, the state holds an enormous base of people who will eventually sell, and most of them already sit inside agents’ own past-client databases. Repeat clients and referrals are the cheapest business an agent will ever earn, yet most never work them, which is why the reactivation numbers matter: partners on the ez Home Search platform reactivate past clients, through repeat deals and referrals, at 2.5 to 5 times the market rate.

The mechanics are what make that possible. An accurate automated valuation model, or AVM, built to be the most accurate available anywhere, gives an owner a real estimate rather than a hopeful guess, and it updates as the market moves. Co-branded home-value pages and listing-alert newsletters keep the agent’s name on the owner’s screen month after month, so when a life event finally turns a maybe into a listing, the agent is already there. This is where the tax detail from the last section pays off twice: a seller deciding on price needs to understand how a buyer’s post-sale tax reset and the transfer tax shape both the offer they will get and the proceeds they will keep. An agent who can show that math wins the listing over the one who quoted the highest number to get in the door.

Single-story suburban ranch-style home in Michigan with an attached garage and trimmed lawn
A large, high-ownership base of Michigan homes means most of an agent’s future listings already sit in their past-client database.

It also answers Michigan’s rate-lock problem. Plenty of owners will not sell casually while they hold a low mortgage rate, but they will watch their equity and their tax bill, and the platform keeps them engaged on exactly those questions until the moment they are ready to move. The seller lead you cultivate this way was already warm long before it became a transaction.

Winning buyer leads across Michigan’s regions

Buyer leads in Michigan look completely different depending on where you stand, so the platform that surfaces them has to read the whole state at once. The record international in-migration is concentrated in Metro Detroit and Grand Rapids, where new arrivals become first-time buyers who need patient guidance and a local expert who will not sell them out. In-state movers are flowing toward lake and rural counties, and their price expectations, timelines, and must-haves look nothing like a downtown buyer’s. Affordability sorts the map too: the first-time buyer priced for Detroit or Lansing is a different lead than the upgrader shopping Ann Arbor or Grand Traverse.

What ties them together is speed and signal. In a West Michigan market running near 1.3 months of supply, listings move before a buyer on a slow site has even seen them, so the minute-by-minute updates on ez Home Search are the difference between touring a home and reading about the one that sold. Saved searches and the activity behind them show which contacts are close to acting: a dormant search suddenly reopened, the same listing saved and returned to twice, an alert opened the day it lands. That behavior flows into the agent’s own CRM, with automated follow-up through ezNurture in Follow Up Boss, the largest real estate agent CRM, and running deepest in Sure Send. The agent calls the buyer whose activity says they are ready, already knowing the neighborhoods and price range they keep returning to, which is why a lead sourced this way tends to convert in 30 to 60 days rather than sitting cold in a database.

Michigan’s ten largest counties are where the greatest share of that buyer demand concentrates, and they are the natural first map for any agent deciding where to compete.

RankCountyPrincipal cityNote
1WayneDetroitLargest county; county seat is Detroit
2OaklandTroyCounty seat is Pontiac; Troy is the largest city
3MacombWarrenCounty seat is Mount Clemens; Warren is Michigan’s third-largest city
4KentGrand RapidsCounty seat and largest city
5GeneseeFlintCounty seat and largest city
6WashtenawAnn ArborCounty seat and largest city; anchored by the University of Michigan
7OttawaHollandFast-growing lakeshore county; county seat is Grand Haven
8InghamLansingState capital; county seat is Mason
9KalamazooKalamazooCounty seat and largest city; home to Stryker
10LivingstonHowellExurban commuter county between Detroit and Lansing; Brighton is its other principal city

County populations from U.S. Census Bureau American Community Survey estimates; largest-city and county-seat assignments verified against county and Census records.

The remote-work demand most Michigan agents still underrate

The remote-work shift is the buyer signal most Michigan agents wrote off too early, and it is quietly reshaping demand in exactly the counties they cover least. The headlines calling remote work dead compare today against the spring-2020 emergency peak, when almost everyone was sent home. Measured against the level before the pandemic, remote work has roughly tripled and held there since 2023. By the fourth quarter of 2024, the Bureau of Labor Statistics put the number of Americans working from home at least part of the time at 36.7 million, up from 32.5 million the year before, a telework rate of 23.4%. On the employer side, the Census Bureau’s Business Trends and Outlook Survey, the largest study of its kind, found companies expecting to hold remote work at roughly the same level five years from now. This is a settled plateau, and the surveys show it holding.

Sandy dune path through tall grass along a calm Michigan lakeshore
Lake-country and Up North counties are where the lasting remote-work shift is quietly adding buyer demand.

That plateau moves people, and it moves them toward amenities. The USDA Economic Research Service found that rural counties nationally reversed more than a decade of decline and gained roughly 974,000 net migrants from 2020 through 2024, concentrated in working-age adults from 25 to 44, the exact group most able to work from anywhere. Michigan is a textbook beneficiary. The state’s own data already shows it: rural counties held 16.5% of the population but drove 40.8% of recent growth. The geography positioned to capture more of it is the geography most agents treat as a side market, the Grand Traverse Bay and Petoskey areas Up North, the West Michigan lakeshore, mid-Michigan’s smaller communities, and even Upper Peninsula towns like Marquette, where in-migrants from Chicago and beyond have already pushed prices well past what local incomes support.

For an agent, this is a practical edge. The remote buyer wants specific things a listing agent can speak to directly: a home office with a door that actually closes, a detached structure or accessory dwelling unit that can hold a workspace, more room than a city condo offers, and genuinely fast rural internet, which is the requirement that quietly sinks more of these deals than price ever does. Michigan is even legislating toward the supply: Grand Rapids adopted zoning changes in 2024 that allow accessory dwelling units as a permitted use, and lake-country demand for guest-and-office space keeps rising. The agent who knows which townships have broadband, which lots allow an ADU, and how the second-home tax math works is the agent a relocating remote buyer keeps. Most competitors are still waiting for these buyers to disappear. They are not disappearing, and owning the county they are moving into is how you meet them first.

How Michigan’s six regions actually differ

Michigan’s regions diverge so sharply that they reward different lead strategies, different price conversations, and different timing. A quick tour makes the point, and it is the clearest argument for owning a defined territory rather than spreading a generic campaign across the whole state.

Aerial view of the Ann Arbor, Michigan cityscape with tree-lined streets and mid-rise buildings
Ann Arbor’s university and research economy makes it one of Michigan’s costliest markets, a different lead problem than affordable Detroit or Lansing.
RegionWhat defines the marketSource (year)
Metro Detroit / Southeast (Wayne, Oakland, Macomb)Detroit growing a second straight year to 645,705; affordable core plus revitalizing downtown and neighborhoodsCity of Detroit / Census (2024)
West Michigan / Grand Rapids (Kent, Ottawa)A national seller’s-market hotspot near 1.3 months of supply; Ottawa median up 8.2% to $395,000GVSU Seidman; WMLAR (2024)
Northern Lower / Up North (Grand Traverse, Emmet, Leelanau, Charlevoix)Heavily seasonal and second-home driven; about half of Traverse City-area vacant units are seasonal or recreationalCity of Traverse City (ACS 2016–2020); Oltersdorf (2024)
Upper Peninsula (Marquette, Houghton)Amenity migration pushing some Marquette prices past $1 million against a local median income near $44,000Bridge Michigan (2024)
Mid-Michigan / Lansing (Ingham, Eaton, Clinton)The affordability release valve; Greater Lansing’s affordability index read above 100 in late 2024Greater Lansing Association of REALTORS (2024)
Ann Arbor / WashtenawAmong the state’s costliest markets; demand anchored by the University of Michigan and the health and research economyUniversity enrollment reporting (2023–2024)

Over a career, the map shifts, and the state’s own projection tells an agent where to plant. The Michigan Center for Data and Analytics projects the state to grow slightly through the early 2030s and then ease to about 9,906,000 by 2050, even with continued positive migration. Growth concentrates: only 25 of 83 counties are projected to gain population, and four of the five fastest-growing counties sit in or around the Grand Rapids metro. The softest trends cluster in the western Upper Peninsula and the Saginaw Bay region. None of this contradicts today’s record population. It is the difference between the near term, where Michigan is growing on international arrivals, and the long term, where an aging population makes migration the only source of growth, concentrated in specific places. Read together, the two horizons say the same thing to an agent choosing where to build: near-term demand is real statewide, and the counties with staying power are worth claiming now.

Which side of that map are you on? See whether your Michigan county is still available before someone else builds there. (Check your county and book a call.)

Real estate leads beyond Michigan’s big metros

The counties past Detroit and Grand Rapids are where an agent can own a whole market rather than fight for a corner of one. These are the lifestyle and second-home markets where local knowledge counts most and where a recognized name travels furthest, and they span the state from the Grand Traverse wine country to the Keweenaw.

CountyRegionCommunities
Grand TraverseGrand Traverse Bay / Up NorthTraverse City, Kingsley, Interlochen, Acme
EmmetLittle Traverse Bay / northern tipPetoskey, Harbor Springs, Mackinaw City, Alanson
LeelanauLeelanau Peninsula / wine countrySuttons Bay, Leland, Northport, Glen Arbor
CharlevoixLake Charlevoix / northern Lake MichiganCharlevoix, Boyne City, East Jordan, Boyne Falls
MarquetteUpper Peninsula / Lake SuperiorMarquette, Ishpeming, Negaunee, Gwinn
HoughtonUpper Peninsula / KeweenawHoughton, Hancock, Calumet, Lake Linden
BerrienSouthwest / Harbor Country lakeshoreSt. Joseph, Benton Harbor, New Buffalo, Niles
MidlandMid-Michigan / Tri-CitiesMidland, Coleman, Sanford

Communities verified against county and municipal records. Leland is the Leelanau County seat; Suttons Bay is its largest village.

These markets also carry a rules problem an informed agent turns into an advantage. Michigan has no statewide short-term-rental law, so whether a lake cottage can be rented nightly depends entirely on the specific municipality, and the statewide picture is unsettled: preemption bills that would limit local bans, most recently Senate Bill 104 and House Bill 109, have moved through the legislature without becoming law. For a buyer weighing a rental in Traverse City versus a township next door, that distinction is the whole investment case. The agent who knows the local ordinance, and pairs it with the second-home tax math from earlier, is worth more to that client than any national portal ever will be. That is the kind of expertise that generates referrals in a small market, where reputation is the whole game.

Why the ez Home Search model converts Michigan leads

A man in business attire stands at a desk, talking on a headset while using a laptop to manage Michigan real estate leads, with two monitors displaying web pages in a bright office.

The ez Home Search model converts because it hands an agent a defined territory, ownership of the leads inside it, and a reason for those leads to arrive warm instead of contested. The core of it is the Exclusive County Partnership: one agent, team, or brokerage holds an entire Michigan county, co-branded across the consumer experience, with no competing partner inside that territory. There is no charge per lead and no share of the commission when a deal closes, so a big month of leads never turns into a bigger bill.

The reason the leads convert comes down to how they are generated. Buyers and sellers come to ez Home Search because it is The Only Confidential Home Search, which is how the company delivers on its promise of A Better Way To Discover Real Estate. A person’s contact details and budget are not sold, recycled, or broadcast to a crowd of businesses they never chose. Instead they are matched with a single vetted local expert, the county partner, and connected to a hand-picked network of other trusted professionals only if and when they want them. A lead that reaches a Michigan partner this way already trusts the platform and has shown real intent through real activity, which is why the connection tends to hold for years rather than weeks.

From there the supporting pieces map straight onto the Michigan pains already covered. Database reactivation puts the partner’s existing past clients and sphere back to work at 2.5 to 5 times the market rate, which matters enormously in a 73.2%-ownership state. Relocation retention protects the listing when a Michigan owner starts planning a move to Texas or Florida or the Carolinas: because the platform covers the whole country, the partner sees that client shopping the destination market early, reaches out before the departure home ever lists, and keeps it rather than handing it to whoever the client stumbled onto while browsing elsewhere. The compounding asset underneath all of it is a recognized name across a single county, one of 83 in Michigan. And ezVerify.ai handles the compliance exposure that comes with prospecting by phone or text, confirming consent, keeping the recording that proves it, and screening numbers before anyone dials. A strong team could stitch some of these pieces together on its own. The point of the partnership is that it arrives already built, co-branded, and running from day one.

Is your Michigan county still available

Only one partner holds a Michigan county. That single fact is the entire appeal and the entire pressure at once. Once a county is claimed, no competing agent can take the same co-branded position inside it, and many of Michigan’s counties are already spoken for, with more claimed every month. The counties with the most staying power, the growing metros and the amenity markets buyers keep moving into, tend to go first. The engine behind the partnership is plug-and-play, so a new partner steps onto a platform that people in their area already use rather than starting from a blank page. What remains to be seen is simply whether the Michigan county you have in mind is still unclaimed.

Three ways to get Michigan real estate leads, and the one that lasts

An agent deciding how to generate Michigan leads has three roads open. Road one is the status quo: buy shared leads from the legacy portals, compete for the same names against everyone else who bought them, and rebuild the pipeline from zero every month whether or not last month’s batch closed. Road two is the far end: assemble your own version of the whole machine, the national-quality data, the IDX, the AVM, the CRM, the compliance layer, and a steady stream of content, a build that costs millions and where the underlying data still stays beyond what one team can reach. Road three sits in the middle and is the one most partners choose: own your Michigan county, own the leads that come from it, pay one predictable fee with no charge per lead, and meet buyers and sellers who arrive warm because they chose to be there.

The honest trade-off is worth naming. County exclusivity means the position is gone the moment another agent claims it, so the model rewards moving before your market does, and the leads it produces reward follow-up rather than paying off the instant they arrive. The payoff for working it that way is the strongest number in this piece: partners reactivate past clients at 2.5 to 5 times the market rate, and the exclusive, chosen leads the platform delivers are built to convert in 30 to 60 days rather than sitting cold.

If you want to see whether your Michigan county is still open, check your county and book a call. That one step decides everything else.

Frequently asked questions

How do seller lead strategies differ between Metro Detroit and West Michigan?

They differ because the two markets are in different places on the cycle. In West Michigan, with Grand Rapids running near 1.3 months of supply and Ottawa County prices up 8.2% in 2024, the seller conversation is about capturing a strong price in a fast market and moving quickly, so speed and an accurate valuation win. In Metro Detroit, where the city is growing again from an affordable base, the conversation leans on equity that has been building quietly and on helping an owner understand what their next move actually costs.

The common thread is that both reward an agent who owns the territory and reaches owners with a credible value estimate before a life event forces a decision. A platform that keeps your name in front of past clients across both cycles is worth more than a lead vendor selling the same Detroit name to five agents at once.

Where do buyer leads come from in Michigan’s Up North and lake-country markets?

They come from a mix of second-home buyers, remote workers, and relocating retirees, which is why roughly half the vacant housing in the Traverse City area is seasonal or recreational. That changes the lead entirely: the buyer is often shopping from downstate or out of state, on a longer timeline, and weighing a lifestyle purchase rather than a primary residence.

An agent reaches them with national coverage and patience, because the person browsing Grand Traverse or Charlevoix listings today may buy in a year. An agent who stays present through that window, and who can speak to the second-home tax difference and local short-term-rental rules, is the one who converts the lead when it finally moves.

How does Michigan’s Proposal A tax uncapping change a listing appointment?

It gives an agent a concrete way to protect the buyer and win the seller’s trust. Under Proposal A, a home’s taxable value is capped while one owner holds it, then resets to about half of market value the year after a sale, so the buyer’s tax bill can be well above what the seller currently pays. Most agents skip this. The one who runs the real post-sale number looks like the only professional who understood the deal.

On the seller side, the same knowledge helps set a realistic price, because a buyer who has to absorb a higher tax bill after the sale has less room in their offer. An agent who walks a seller through that math wins the listing over someone who simply quoted the highest number.

How should I time seller outreach around Michigan’s seasonal price swing?

Plan for a market that swings roughly one-fifth from summer peak to winter trough, which is near double the national pattern. That means the spring and early summer are when most sellers get their strongest price, and the outreach to line up those listings has to happen in the slow winter months, well before the market heats up.

The mistake is treating winter as dead time. It is prospecting time. A platform that keeps past clients engaged with home values and market updates through the cold months means the listing conversations are already underway when the selling season opens, rather than starting cold in April.

How do I generate leads in the Upper Peninsula, where amenity migration has outrun local incomes?

Work both sides of the gap. In markets like Marquette, in-migrants from Chicago and beyond have pushed some prices past $1 million against a local median income near $44,000, which creates two distinct leads: the arriving buyer with outside money and the local owner whose home is suddenly worth far more than they realized.

An agent who owns that territory serves both, guiding newcomers who do not know the market and reaching longtime owners who may not know their equity. National coverage matters here because so many buyers arrive from elsewhere, and being the recognized local name is what turns a remote search into a local closing.

Does it make sense to farm for listings in Detroit now that the city is growing again?

Yes, and the growth is exactly why. Detroit added residents for a second straight year to reach 645,705 in 2024, reversing seventy years of decline, and investment is spreading from the riverfront and Michigan Central into surrounding neighborhoods. A rising, revitalizing market with an affordable base is fertile ground for an agent building recognition rather than chasing one-off deals.

The smart play is to become the trusted name in specific neighborhoods as they turn, using consistent presence and honest local guidance, so the owners and buyers there come to you first.

How do I reach the international buyers driving Michigan’s growth?

Meet them where the demand is concentrated, which is Metro Detroit and Grand Rapids, since international arrivals were Michigan’s growth engine in 2024 with a record net gain of 67,608 people. Many are first-time buyers in the United States who need patient guidance and a local expert who will not treat them as a lead to resell.

That is where the confidential, single-expert model earns its keep. A buyer who trusts that their information stays with one vetted agent, rather than being broadcast to a crowd, engages more openly, and the agent who serves them well early earns the referrals that follow inside a growing community.

How do I keep the listing when a Michigan client relocates out of state?

You keep it by seeing the move coming. When a past client starts planning a relocation to a lower-tax or warmer state, their home in your Michigan market is a listing you are positioned to win, but only if you learn about the move before they list with someone at the destination. The usual way agents lose it is silent: the client opens a national portal to shop the new area and quietly connects with a stranger there.

Because ez Home Search covers the entire country, that client shops the destination market on your co-branded platform, and the activity there tips you off well before the listing is in play. You step in early, handle the sale of the current home, and hand the buy-side off to a vetted agent at the destination in exchange for a referral fee. The move stops being a total loss and becomes two transactions.

07.06.2026

Kentucky Real Estate Leads: What Works in a State That’s Really Six Markets

Over the five years through 2025, Warren County added more people than any other county in Kentucky, and the Kentucky State Data Center projects it to grow another 47.3% by 2050, enough to pass Kenton and become the state’s third most populous county. Over that same projection, Letcher County is expected to lose 37.4% of its people and Pike County 35.0%. Those counties sit about three hours apart in the same state, moving in opposite directions, and most Kentucky real estate leads are sold as if they came from one uniform market.

They did not. Kentucky is at least six markets that do not translate to each other: a Northern Kentucky running on roughly two months of supply, a Louisville metro anchored by the world’s largest package hub, a Bluegrass built on horses and universities, a Bowling Green that is the fastest-growing corner of the state, a western lakes region drawing retirees, and an eastern coalfield rewriting what its economy is. A lead vendor that treats all six the same is selling you the average of markets that have no average. This is a look at what is actually happening across each of them, and how the agents, teams, and brokerages who win here get in front of the right buyer or seller first.

Sunrise over the Ohio River and a Louisville, Kentucky bridge
Louisville anchors the tightest large market in Kentucky, and the state’s single largest housing gap.

Kentucky’s housing market shares a few statewide truths before it splits apart

Before the regional differences take over, three things are true almost everywhere in Kentucky. The first is that home prices have been rising faster than the national average. On the House Price Index published by the Federal Housing Finance Agency, Kentucky has ranked among the stronger states for annual appreciation, and because that state index is published continuously, the pattern holds across years rather than reflecting a single hot quarter.

The second is a real shortage of homes. The Kentucky Housing Corporation’s gap analysis puts the shortfall at about 206,207 housing units, split almost evenly between roughly 104,638 for-sale and 101,569 rental homes, and it projects the state will need on the order of 529,000 more homes by 2050 to keep pace. A shortage that large does two things for an agent at once: it supports seller equity, and it makes each listing the scarce asset that everyone competes for.

The third is that well-priced homes move quickly. Statewide inventory has run around 3.6 months, below the five-to-six-month range considered balanced, and in the tightest metros homes sell in roughly 39 to 44 days at about 98% of asking, according to the Greater Louisville Association of Realtors. Tight supply, steady demand, and fast sales are the shared backdrop. Everything past that point is local.

CountyPopulation (2024)Principal city
Jefferson783,022Louisville
Fayette323,725Lexington
Kenton171,288Covington
Warren140,918Bowling Green
Boone139,841Florence
Hardin111,942Elizabethtown
Daviess103,648Owensboro
Madison95,769Richmond
Campbell93,426Newport
Bullitt84,027Shepherdsville

Kentucky’s ten most populous counties and their principal cities. A few carry a wrinkle worth knowing: Boone County’s seat is Burlington, but Florence is its largest city; Kenton and Campbell counties each have two seats, with Covington and Newport the recognized principal cities. Source: U.S. Census Bureau population estimates; Kentucky Transportation Cabinet.

Kentucky’s buyers and sellers come from a churn most lead tools never see

A real estate agent places a “Sold” sign on a “For Sale” post outside a brick house while a smiling couple—new homeowners thanks to valuable Kentucky real estate leads—stands nearby.

The honest answer to “where are the buyers” in Kentucky is that they come from movement inside the state as much as from anyone arriving. Kentucky added a net 37,777 residents in 2024, reaching about 4.59 million, and most of that came from international migration, roughly 31,430 people. Net domestic migration was modestly positive at about 7,294, meaning slightly more people moved in from other states than left. Natural change no longer adds to the total: deaths have outnumbered births in Kentucky every year since 2020, with the most recent confirmed counts at 51,992 births against 53,262 deaths in 2023, according to the Kentucky State Data Center.

Set a net domestic gain of about 7,294 against a state of 4.59 million people and roughly 1.9 million households, and the picture is clear. Migration is one force among many, not the story. The larger movement is internal. Between 2020 and 2023, Jefferson County lost 10,701 residents while its ring counties gained, Bullitt up 2,497 and Spencer up 1,020, along with Oldham and Shelby. Fayette County lost 2,473 while the Bluegrass ring grew: Scott added 2,637, Jessamine 1,993, and Madison 3,742. The Kentucky side of the Cincinnati metro added 19,505 people, led by Boone at 4,028 and Kenton at 2,050.

For an agent, every one of those movements is two pieces of business, not one. A household leaving Jefferson for Bullitt is a listing on one end and a purchase on the other, and if it is a past client, it is a relocation the agent should already know about. Eighty-one of Kentucky’s 120 counties gained population in the most recent year, so this is not a shrinking state. It is a reshuffling one, and the reshuffle is exactly what a statewide lead package flattens into a single number.

Kentucky is growing and shrinking at the same time, and that should change how you talk to your database

Person using a tablet displaying a team management app at a desk, tracking Kentucky real estate leads, with a notebook and pen nearby; another person on a phone call is visible in the background.

Kentucky grew about 2% between 2020 and 2024, and almost all of that growth landed in four metro corridors, Louisville, Lexington, Northern Kentucky, and Bowling Green, while the roughly 30 counties of the eastern coalfields lost about 16,265 people, a decline of 2.5%, over 2020 to 2025. Both facts are true at once. The agent who can explain why has something to tell a client that a page of projections cannot.

The first driver is demographic. Deaths now outnumber births in Kentucky, the first sustained reversal since at least 1960, and about three-quarters of the state’s counties record more deaths than births in a typical year, with a fertility rate near 1.8 against the 2.0 replacement level (Kentucky State Data Center). In the east it is nearly universal: 29 of the 30 Appalachian coalfield counties are in natural decrease, with only Whitley County posting more births than deaths, and by a margin of just 16, according to Kentucky Lantern’s analysis of U.S. Census Vintage 2025 estimates. Pike County alone recorded 427 more deaths than births in a single recent year. When a population ages and has fewer children, decline becomes arithmetic before it becomes anything else.

The second driver is the economic base that left first. The U.S. Energy Information Administration puts the drop in Kentucky coal production at about 79% between 2001 and 2023, from nearly 134 million short tons down to roughly 28 million, and the Kentucky Center for Statistics reports that about 85% of the state’s coal jobs have disappeared over 30 years. When a region’s core industry contracts that far, working-age people follow the work out, and they take their future children with them.

The third driver is where those people go. This is no longer the mid-century Hillbilly Highway, when roughly 3 million people left Appalachia between 1950 and 1970 for factory towns in Ohio and Michigan. Today about three in four people who leave eastern Kentucky stay in Kentucky, most of them landing in the same four metro corridors, so the very move that ages an eastern county grows a Bluegrass or Louisville one. The fourth driver compounds the first three: as population and births fall, the schools, clinics, and small businesses that hold a community together get harder to sustain, which makes a place harder to stay in. The Economic Research Service at the U.S. Department of Agriculture documents the same strain across rural America, where childcare capacity has fallen even as the older population climbs.

Most agents miss the piece that makes this less a Kentucky problem than it first sounds: it is a national pattern. More than two-thirds of all rural counties in the United States lost population between 2010 and 2020, the first decade rural America lost population in its history, and deaths outnumbered births in 55% of rural counties over that span, up from 37% the decade before, according to demographer Kenneth Johnson at the University of New Hampshire’s Carsey School. Since 2018, rural America as a whole has been in natural decrease and grows only where migration reaches it (USDA Economic Research Service). Eastern Kentucky is one steep instance of an arithmetic playing out across the country, a redistribution of people toward opportunity, not a state that failed. That framing is both more accurate and easier for a client to hear.

The place this pays off most is an agent’s own database. Only about 5% to 10% of people buy or sell in a given year, so roughly 90% of the contacts a Kentucky agent already has are sitting in homes they own, not thinking about a move. The two-speed map is a reason to call them. An owner in a thinning eastern county has a real decision to make about whether to sell now, while tight supply still holds the price up, or wait and let the demographics work against them. An owner in Scott or Oldham County is watching value and buyers concentrate toward them and probably does not know it yet. Neither of those is a sales call. It is an agent handing a client the one fact that changes a decision worth tens of thousands of dollars, and that is what earns the listing when the client is ready.

This is the work ez Home Search is built to do for a partner. Past clients come back to a co-branded home search to track their value and their market, the value and market updates keep the agent in front of them without a monthly check-in call, and the platform flags the contact whose activity says they have started to look. It closes the gap that costs agents the most business they never see: nine in ten buyers tell researchers they would gladly work with their agent again, 88% to 92% in the studies, and only about 18% do, even though repeat clients and referrals run close to 41% of a typical agent’s volume. Partners on ez Home Search bring those clients back at 2.5 to 5 times the rate an agent working alone manages, because the platform gives them a reason to reach out long before anyone is ready to sign. The decline this section describes is not the only force at work in these counties. The one pushing the other way is remote work, which most agents have written off and which is quietly repricing the very places that are losing population.

Kentucky’s economy is not one industry, and its housing demand is not one story

Kentucky’s demand is spread across more industries than any single-anchor state, which is why no one employer defines its market. In 2025 the Kentucky Cabinet for Economic Development reported about $10.5 billion in announced private-sector investment across 185 projects and roughly 9,600 projected jobs, at a record average incentivized wage of $29.58 an hour. That breadth is the point.

Bourbon and distilling contribute about $10.6 billion in annual economic impact, support roughly 23,935 jobs, and run across 125 licensed distilleries in 45 of the state’s 120 counties, drawing some 2.5 million tourism visits a year, though the industry’s sales have plateaued and that is a headwind worth naming honestly. Louisville is a national logistics hub built around UPS Worldport, the world’s largest package-handling facility, and UPS is the metro’s largest employer at 20,000 to 25,000 workers. Healthcare has quietly become the backbone employer across much of the state and the leading replacement for lost mining jobs in the east, where Appalachian Regional Healthcare runs 12 hospitals and Pikeville Medical Center has grown to about 3,700 jobs. Central Kentucky is an auto and battery manufacturing region whose mix shifts year to year; the Hardin County battery plant cut jobs in 2025 before Ford announced roughly $2 billion to repurpose the site for energy storage, and even that reinvestment, sized against Hardin’s 112,000 residents, is regional color rather than the county’s whole economy. The Bluegrass runs on horses and land, an equine and agriculture engine worth about $6.5 billion and 60,000-plus jobs by University of Kentucky estimates. And two military installations, Fort Campbell in Christian County and Fort Knox in Hardin County, generate a predictable churn of households rotating in and out on assignment.

Workers on an auto manufacturing assembly line in Kentucky
Kentucky’s demand runs on many engines at once, from auto and battery plants to bourbon, logistics, and healthcare.

The newer commitments show the same spread across regions. GE Appliances is investing $490 million to bring 800 laundry-production jobs back to Louisville by 2027. Apple and Corning committed more than $2 billion at Harrodsburg in Mercer County to make cover glass for iPhones and Apple Watches. General Matter is building a $1.5 billion uranium-enrichment facility at Paducah, a genuine diversification signal for western Kentucky. A utility-scale battery plant in Shelby County represents about $712 million and 1,572 jobs, and a Kingspan data-center thermal plant in Glasgow was Barren County’s largest job announcement in 18 years. A visible layoff stream runs alongside the growth, roughly 3,441 Kentucky workers affected in 2025 by tracked closures, and for an agent that churn is also two-sided: a plant that sheds jobs produces relocations and downsizing sales, not only losses. Kentucky demand comes from many engines at once, and a lead source built to catch one of them will miss the rest.

Six Kentucky markets, six different lead problems

Kentucky’s regions do not just differ in flavor; they pose different lead problems that call for different tactics. An agent who understands which one they are standing in stops running a strategy built for a market three hours away.

RegionAnchor countiesWhat defines the market
Louisville MetroJefferson, Bullitt, Oldham, Shelby, SpencerLogistics-anchored; about 2.5 months of supply and 39-44 days on market; the state’s largest county housing gap (Jefferson short ~40,079 units)
Bluegrass / CentralFayette, Scott, Jessamine, Woodford, Clark, MadisonHorses, land, and universities; Lexington needs ~22,000 units now, rising past 30,000 by 2030, while building only ~600 single-family homes a year
Northern KentuckyBoone, Kenton, CampbellCincinnati and CVG cargo spillover; ~$300,000 median, ~2.1 months of supply, 33 days on market; the Brent Spence corridor rebuild underway
South-Central / Bowling GreenWarren, Barren, Allen, SimpsonThe state’s fastest-growing market, cooling toward balance in 2025; Western Kentucky University anchors ~1 in 17 regional jobs
Western Kentucky and the LakesMcCracken, Calloway, Marshall, Trigg, Lyon, PulaskiLake second-home and retirement demand; a new I-69 Ohio River crossing at Henderson; some price markets flat to soft
Eastern Kentucky / AppalachiaPike, Floyd, Perry, Letcher, Harlan, BoydCoal giving way to healthcare; “high ground” rebuilds after the 2022 floods; relocation, estate, and downsizing business

Louisville is the tightest large market and the one with the most latent demand. Recent readings put it near 2.5 months of supply with homes moving in 39 to 44 days, yet Jefferson County alone is short about 40,079 housing units, the largest gap in the state, and the single-family building pace runs only 3,300 to 3,600 permits a year. The 2026 county reassessment added more than $8 billion to the tax roll, over $1 billion of it from new construction, a sign of how much value is concentrating there. The lead problem is scarcity: nearly everyone wants in, and the agent who surfaces future sellers early wins.

The Bluegrass is a wealth market with a supply crisis underneath it. Lexington needs about 22,000 housing units now, a figure the Kentucky Housing Corporation and a city-commissioned study project to climb past 30,000 by 2030, while the city builds only around 600 single-family homes a year, roughly a third of its pre-recession pace, and Fayette County permits have fallen about 40% from their 2021-22 peak. Around it sit Scott, Jessamine, and Woodford, exurb and horse-country counties absorbing the overflow. The lead problem is reaching high-value estate and land sellers that generic lists never surface.

Northern Kentucky behaves like the Cincinnati suburb it is, and it runs tighter and pricier than the rest of the state. The Northern Kentucky Association of Realtors reported a year-to-date median around $300,000 through late 2025, up about 6.4%, with roughly 2.1 months of supply, 33 average days on market, and homes selling near 98% of list. A named pipeline of new construction is moving through the planning commission, including an 882-unit development in the Union area of Boone County, a pair of Boone subdivisions totaling 419 homes, and a 126-lot community for buyers 55 and older in Kenton County. The Brent Spence Bridge corridor, a project now above $4 billion that broke ground in May 2026, will reshape commute geography for years. The lead problem is speed in a market where good listings clear in a month.

Bowling Green is the state’s growth champion that spent 2025 catching its breath. Warren County has been among the fastest-growing communities of its size in the country, yet inventory rose toward 6.1 months by mid-2025 and days on market stretched to about 109 while the median held near $349,000, a genuine shift toward balance even as other metros stayed tight, according to local brokerage figures drawn from the regional MLS. Western Kentucky University anchors the regional economy, supporting roughly one in every 17 jobs across a seven-county area, and a state-funded tornado-recovery program is adding rental housing across the region. The lead problem is a market normalizing faster than a statewide vendor’s assumptions.

Lake Cumberland winds between forested hills in south-central Kentucky
Kentucky’s lakes region draws second-home and retirement buyers who behave nothing like a metro commuter.

Western Kentucky and the lakes run on water and retirement. Kentucky Lake, Lake Barkley, Lake Cumberland, and Land Between the Lakes draw second-home and retirement buyers into Calloway, Marshall, Trigg, Lyon, and Pulaski counties, and General Matter’s Paducah investment plus the new I-69 crossing at Henderson, whose first phase opened in November 2025, give the region fresh economic footing. Some western price markets remain flat to soft, which is itself a divergence from the growth corridors. The lead problem is a seasonal, lifestyle-driven buyer that behaves nothing like a metro commuter.

Eastern Kentucky is repositioning, not closing. Healthcare has become the leading employer, and the “high ground” rebuild after the 2022 floods has reached eight communities across five counties, with the first homes at the Skyview development near Hazard built, sold, and occupied by early 2026. The business here is real but different: relocation, estate, and downsizing work in a market where the population is thinning and aging. An agent who writes the region off entirely leaves that business to no one.

The counties beyond the metros are where Kentucky’s next deals hide

Most of Kentucky’s growth is happening outside its six biggest cities, which is exactly where the competition thins out. With 81 of 120 counties gaining population recently, the exurb rings and lake counties hold farmable, less-contested business that an agent chasing only Louisville and Lexington hands to whoever shows up. The counties below sit beyond the major metros and each supports a real base of communities.

Aerial view of a Kentucky county-seat town with a clock-tower courthouse
Most of Kentucky’s growth is happening in county-seat towns and exurb counties, well beyond Louisville and Lexington.
CountyRegionCommunities
McCrackenWestern KentuckyPaducah, Reidland, Lone Oak, West Paducah
CallowayWestern Kentucky lakesMurray, Hazel, New Concord, Lynn Grove
PulaskiLake CumberlandSomerset, Burnside, Science Hill, Ferguson
BoyleCentralDanville, Perryville, Junction City
NelsonBourbon countryBardstown, Bloomfield, New Haven, Boston
OldhamLouisville exurbLa Grange, Crestwood, Pewee Valley, Goshen
ScottBluegrass exurbGeorgetown, Sadieville, Stamping Ground
PikeAppalachiaPikeville, Coal Run Village, Elkhorn City
ChristianFort CampbellHopkinsville, Oak Grove, Pembroke, Crofton
BoydNortheast / AshlandAshland, Catlettsburg, Cannonsburg

Scott County, projected to grow another 46.1% by 2050, and Oldham County, a longtime Louisville exurb, absorb households priced out of or looking to leave the core. Nelson County anchors bourbon country around Bardstown. Christian County carries the Fort Campbell relocation cycle. Boyd County holds the Ashland market on the Ohio River. These are not leftover markets; they are where a partner who owns the county name gets to buyers and sellers before a metro-focused competitor even looks.

The Kentucky tax math that actually moves a relocation decision

Kentucky’s affordability is a real lead driver, but only for the agent who can put numbers on it. Most describe the state as “low cost” and leave it there. An agent who can run the actual math turns an out-of-state buyer’s curiosity into a relocation conversation, and the numbers are worth knowing cold.

Start with property taxes, which average about 0.74% of assessed value, among the lower rates in the country, with a homestead exemption of $49,100 for the 2025-2026 period for owners 65 and older or totally disabled. Then move to the income tax, which drops to 3.5% effective January 1, 2026 under HB 1. The mechanism behind that cut deserves an honest explanation, because it signals stability: the 2022 HB 8 allows a half-point reduction only when two conditions are both met at fiscal year-end, the state missed one of them in fiscal 2023 and hit both in 2024, and any further cut to 3.0% for 2027 is not automatic and requires a separate legislative vote. This is a deliberate, tested phase-down, not a promise that could vanish.

The variable most comparisons miss is the county occupational tax, a payroll tax that changes take-home pay across a county line. Rates range widely: Fayette and Lexington sit at 2.25%, while Kenton is 0.70%, Boone 0.80%, and Campbell 0.90%, with Warren, Hardin, Daviess, and Scott around 1.00% and several counties, including Bullitt, Oldham, Calloway, and Christian, levying none at all. Two buyers with identical salaries keep different amounts of money depending on which county they choose, and almost no relocation comparison accounts for it. Closing costs stay modest too: Kentucky’s deed-transfer tax under KRS 142.050 is $0.50 per $500 of value, about 0.10%, or roughly $150 on a $150,000 sale, paid by the seller, with no local add-on.

There is one more point that reassures a nervous buyer. A rising assessment does not automatically mean a proportionally higher tax bill, because Kentucky’s HB 44 caps the growth in a taxing district’s revenue from existing property at 4% a year and forces the tax rate to roll back as values climb. Boone County actually lowered its real-property rate in September 2024 even as assessed values rose. An agent who walks a relocating buyer through property tax, income tax, the local occupational rate, and the HB 44 rollback is having a conversation no shared-lead vendor can have for them.

How Kentucky agents try to win listings today, and where each approach stalls

In a state this tight on inventory, the scarce asset is the listing, and most of the ways agents chase listings today were built for a market Kentucky no longer is. With statewide supply near 3.6 months and a 206,000-home shortfall, the competition is for sellers, and a lead source that treats Kentucky as one market cannot fit six. It is worth being fair about each common approach before naming its limit.

Shared portal leads sit at the center of most agents’ plans, and they do produce names. The structural problem is that a single Louisville or Lexington contact gets routed to whichever agent pays the most for it, so the agent starts cold, up against several others who paid for the same person. An IDX website an agent builds and maintains is a genuine owned asset, but it matures slowly and most single agents cannot keep it fast, fresh, and found. Cold calling and dialers still work for the persistent, but they carry real exposure under the Telephone Consumer Protection Act and Do Not Call rules, which put the job of proving consent on the person who placed the call. Predictive-seller and absentee-owner list tools can point at who might sell, yet a score is not a relationship, and the agent still has to earn the trust that moves a name on a list toward an actual listing. Generic all-in-one CRMs are one more platform to set up and maintain, and they sit apart from wherever a client actually spends time online. And do-it-yourself content and paid ads spike with spend and fade when the budget stops, without building an audience that compounds.

The 2024 National Association of Realtors settlement raised the stakes on all of it. Buyer-agent compensation is now negotiated directly and agency agreements are signed up front, which puts a premium on warm, pre-qualified, high-intent connections and penalizes cold volume. Every one of the approaches above can produce activity. What none of them produces on its own is an exclusive, warm relationship the agent owns and keeps.

The remote-work demand most Kentucky agents are not pricing in

The counter-force promised earlier is remote work, and the agents who wrote it off are misreading the data. The idea that remote work is finished comes from comparing today against the spring-2020 peak, not against the years before the pandemic. Measured properly, it has settled at a level far above where it started and shows no sign of retreating. The Bureau of Labor Statistics reported that the teleworking share of workers rose to 23.4% by the fourth quarter of 2024, with 36.7 million people putting in at least part of their workweek from home, up from the year before. The Census Bureau’s Business Trends and Outlook Survey found that about 31.2% of firms had employees working from home, and those employers projected the same level five years out. This is a settled feature of how Americans work, not a fad on its way out.

That national fact lands on specific Kentucky geography. The exurb rings around Louisville and Lexington, Oldham, Bullitt, Scott, Jessamine, and Shelby, along with the lake and lifestyle counties of Calloway, Marshall, Trigg, Lyon, and Pulaski, and even the repositioning counties of the east, are exactly the places positioned to capture buyers who no longer have to live near an office. What makes it real in Kentucky is infrastructure. The state secured about $1.1 billion in federal broadband funding to reach 86,406 eligible locations, with roughly 200,000 homes counted as unserved or underserved, which is the difference between a scenic county and a workable one for a remote household.

For an agent, this is a usable edge, not a talking point. Remote and hybrid buyers want specific things a listing can be marketed on: a home office with a door that closes, a detached studio or an accessory dwelling unit to work from, room to spread out, and internet fast enough for a full day of video calls. The agent who markets those features and farms the exurb and lake counties reaches a buyer that statewide lead vendors, still selling metro ZIP codes, never see. In a state where demographics are pulling people toward a handful of corridors, remote work is the force that gives a smaller county a second act, and the agent who sees it first gets the listings that come with it.

Why an Exclusive County Partnership converts where shared leads do not

A realtor shows a couple around a bright living room while other people stand and chat in the background, highlighting the growing interest in Kentucky real estate leads.

The lead source built for a plural, two-speed state is one that gives a single agent, team, or brokerage an entire county and no charge per lead. That is the ez Home Search Exclusive County Partnership: one partner to a county, their brand carried through the consumer experience, no per-lead fee, and nothing taken from the commission at closing. Only one partner holds a county, so the position cannot be bought out from under the agent who earns it.

The reason the connections convert comes down to how consumers reach them. People come to ez Home Search because it is The Only Confidential Home Search, where a person’s contact details and budget stay theirs rather than being resold or passed around to businesses they never picked, and where they work with a Single Local Expert instead of being handed to whoever paid the most. That is how ez Home Search delivers on its promise of A Better Way To Discover Real Estate. Because the experience is private and genuinely useful, people engage honestly, and their activity tells the partner who is ready: a search picked back up, a home value re-run, a saved listing revisited. The partner opens the conversation warm, already knowing what the person is after, rather than dialing a cold name three other agents also bought. That is why partners on the platform bring their past clients back at 2.5 to 5 times the market’s reactivation rate, and why fresh leads tend to convert inside 30 to 60 days.

The rest of the partnership answers Kentucky’s specific pains. The core-to-ring reshuffle and the Fort Campbell and Fort Knox military cycles mean past clients relocate on a predictable schedule, and since ez Home Search works in every U.S. market, a client planning a move keeps searching on the partner’s co-branded platform instead of drifting to a legacy portal, so the home they are leaving stays the partner’s listing rather than going to a stranger. The database reactivation described earlier runs on the same engine: a co-branded search past clients return to, home-value and market updates that keep the relationship warm, and the two-speed conversation that starts naturally when an owner sees what is happening in their own county. In a state with 81 of 120 counties in play, becoming the recognized name in one of them wins listings before any comparison happens, because reputation and referral decide most of these choices. And ezVerify.ai handles the riskiest part of prospecting, confirming consent, keeping the recording that proves it, screening numbers against a known-litigator database, and suppressing Do Not Call registrations, so the compliance exposure of cold outreach is answered before the first call.

One partner per Kentucky county, and they are claimed month by month

The Exclusive County Partnership is limited to one partner per county, and Kentucky’s counties are being claimed month by month. Many of the state’s 120 counties are already held, and the model performs the same in a Jefferson or Fayette metro as it does in a Pulaski or Boyd county, because a trusted local name counts for as much across a rural county as across a metro. None of the technology behind it is the partner’s to build. They step onto a platform already used by millions, carrying their own brand, with the home search, the valuations, the alerts, and the follow-up tools already running on day one.
The practical question for an agent reading this is simple: is your county still open. Given how the two-speed map is drawn, the counties tied to growth corridors tend to go first, but the reactivation and relocation-retention value applies everywhere, including the markets that are thinning, where owning the relationship is worth even more.
Three ways to source Kentucky leads, and the one that holds up

An agent deciding how to generate Kentucky leads is really weighing three routes. The first keeps the shared portal habit going, buying names that get routed to whichever agent pays the most, then opening every call cold against the others who bought that same person. Another is to build the whole apparatus yourself, an IDX site, a data and valuation engine, a content operation, and a compliance system, which costs millions and years and still leaves you without ownership of a county. The third is the middle path most working agents actually want: hold an Exclusive County Partnership where the platform is already built, the leads belong to you alone, and there is no per-lead fee.
The honest trade-off is exclusivity itself. Because only one partner holds a county, the model rewards moving before your market is taken, and if a competitor secures your county first, it stays theirs until they leave. That is the cost of a position no one can copy from the outside.

One number is worth remembering. When ez Home Search partners work an owned database, the past clients come back at a multiple, 2.5 to 5 times the reactivation a typical agent sees. With roughly 90% of a Kentucky database sitting out of the market this year, and repeat and referral business the cheapest an agent ever earns, that multiple separates a database that sits idle from one that produces. Check whether your county is still open.

Frequently asked questions

With Kentucky carrying only about 3.6 months of housing supply statewide, and Northern Kentucky and Louisville tighter still, how do agents here find sellers before a home hits the market?

The agents who consistently find early sellers stop waiting for listing signals and start watching engagement. In a market this tight, the seller you want is a past client or sphere contact whose behavior shows they are thinking about a move before they have called anyone. That means a co-branded home search they return to, home-value updates they open, and activity signals that flag a search picked back up or a valuation re-run. ez Home Search partners work exactly this way, reaching the owner while the interest is still forming rather than competing for a listing already on the market.

Where are Kentucky’s buyers actually coming from, when international migration drove most of the state’s recent growth and Jefferson and Fayette lost residents to their own ring counties?

They come from three places at once, and a lead strategy has to account for all of them. International arrivals concentrate in Louisville and Lexington. The larger flow is internal, from the core counties out to their rings, Jefferson to Bullitt, Oldham, and Spencer, Fayette to Scott, Jessamine, and Madison. And a steady stream arrives from other states, a modest net gain but real. For an agent, the internal churn matters most, because each move is a listing and a purchase, and a past client relocating within the state is business the agent should already know is coming.

How can a Kentucky agent use the state’s population shifts to start conversations with past clients who are not buying or selling right now?

The population data is a natural reason to reach out to the 90% of a database that is not transacting this year. An owner in a growth corridor benefits from understanding that value and demand are concentrating toward them; an owner in a thinning county benefits from weighing whether to sell into tight supply now rather than later. The conversation works when it is framed as guidance, not a pitch, and it works best on a platform the client already trusts. ez Home Search gives a partner the co-branded home search, the value updates, and the market context to open that discussion, which is a large part of why its partners reactivate past clients at several times the market rate.

How should a Northern Kentucky agent capture demand tied to the Cincinnati and CVG cargo hub and the Boone-Kenton-Campbell growth ring?

Northern Kentucky moves fast and rewards speed, so the priority is being the known local name before a listing appears. The region runs near 2.1 months of supply with homes selling in about 33 days at close to 98% of list, and a large pipeline of new construction is moving through Boone and Kenton counties. An agent who owns the county position on a co-branded platform, and who is set up to reach a buyer the day a fitting home lists, wins in a market where waiting a week means losing the deal. The Brent Spence corridor rebuild will keep reshaping commute patterns, which is one more reason to be the source residents already use.
What is the best way to work the military relocation churn around Fort Campbell and Fort Knox, where households rotate through on a predictable cycle?

Military markets reward systems that catch a predictable cycle, because households arrive and depart on assignment rather than on the open market’s schedule. The retention piece matters most: a service member relocating out of Christian or Hardin County still owns a home there, and if the agent stays connected through a co-branded national platform, that departing home stays the agent’s listing instead of going to a stranger on a portal. National coverage also lets the agent refer the outbound client to a trusted agent in the new market. ezVerify.ai adds consent and compliance cover for the outreach that keeps those relationships alive.

In eastern Kentucky, where coal jobs have fallen sharply and families are moving to new “high ground” communities, where does an agent’s next deal come from?

The eastern market is thinner but far from empty, and the business simply looks different. Healthcare is now the leading regional employer, the “high ground” rebuild after the 2022 floods has produced new communities with homes already sold and occupied, and an aging population generates steady estate, downsizing, and relocation work. An agent who owns the relationship in these counties, rather than chasing one-off transactions, captures the moves that a thinning market still produces every year, and owning that relationship is worth more here than in a market where buyers are plentiful.

With Kentucky’s income tax dropping to 3.5% in 2026 and property-tax rates that rank near the bottom nationally, how do agents turn the state’s affordability story into out-of-state buyer leads?

The affordability story converts when an agent puts real numbers on it instead of calling the state cheap. That means walking a relocating buyer through the property-tax rate near 0.74%, the income tax dropping to 3.5% in 2026, the county occupational tax that changes take-home pay across a county line, and the HB 44 rule that keeps a rising assessment from automatically raising the bill. An agent who can run that math is having a conversation a shared-lead vendor cannot, and it is exactly the kind of content a co-branded platform can put in front of out-of-state searchers before a competitor reaches them.

Does it make sense to farm a whole Kentucky county when a fast-growing one like Warren or Scott looks nothing like a cooling Bowling Green or a thinning eastern county?

A whole-county farm makes sense precisely because Kentucky’s counties differ so much, as long as the strategy fits the county. A fast-growing county rewards being the known name for a flood of arriving buyers; a cooling or thinning county rewards owning the relationships that produce relocation and estate business. The mistake is running one statewide playbook across markets moving in opposite directions. The Exclusive County Partnership works in both because it is built on owning the local relationship, and the local relationship is valuable in a booming county and a shrinking one alike.