The best real estate leads in Massachusetts are not for sale. The agents who win this market are not the ones who outbid everyone for the same shared names the legacy portals resell; they are the ones who own the local relationship long before a person is ready to buy or sell.
That matters more here than almost anywhere. Massachusetts has spent years as one of the most supply-starved, high-price markets in the country. The statewide single-family median has pushed past $600,000 and keeps setting records, while inventory sits near a month and a half of supply, roughly a quarter of what a balanced market carries. Homes are scarce and competition for every active buyer and seller is fierce, so the cost of a lead climbs while the pool everyone fights over stays small.
The agents who win play a longer game. They stay in front of the 90 to 95% of residents who are not in the market this month, so they are the trusted local name, and they catch the signs of a move first, when those people are finally ready. No single agent can reach that whole population and hold it for years; that is what ez Home Search is built to do. And there is no single Massachusetts market to do it in. Greater Boston, the Cape and Islands, the Berkshires, the Pioneer Valley, Central Massachusetts, and the Gateway Cities each run on different prices, buyers, and reasons to move.
The Massachusetts market runs on scarce supply, not scarce demand
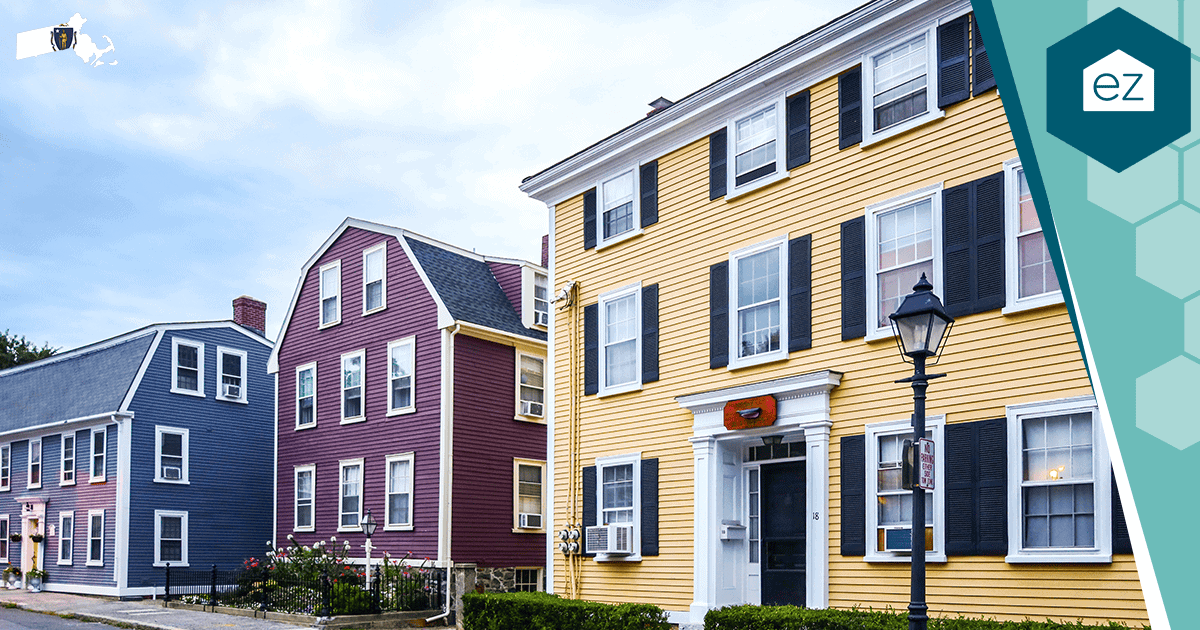
The defining feature of the Massachusetts market is not price or demand on its own. It is how little is for sale, and that has held for years.
The single-family median has reached about $615,000 in recent years and the condo median about $535,000, both records, with prices climbing close to 8% a year at the market’s peak (The Warren Group). These are not one-year spikes. Prices keep setting records because inventory has stayed near a month and a half of supply against the roughly six months a balanced market carries, and well-priced homes have been going under agreement in under three weeks (Massachusetts Association of Realtors).
One reason the shortage holds is the lock-in effect. A large share of owners carry mortgages well below what a new loan would cost them, so moving means trading a cheap mortgage for an expensive one. Many stay put, and the resale pipeline stays thin. That is a national condition, but it bites harder in a high-price state where the monthly payment difference runs into the thousands.
New construction has not filled the gap. Greater Boston has been permitting fewer homes almost every year, down from about 15,000 in 2021 to the low 13,000s more recently, and by mid-2025 was running roughly 44% below the 2021 pace, with Boston at its lowest permitting since 2012 (2025 Greater Boston Housing Report Card). A market that builds less each year while prices set records tells agents something plain: listings stay scarce, every active client is expensive to win, and the edge goes to whoever is already the trusted local name before those clients start looking.
That single fact should shape where an agent spends time and money. Head-on competition for this month’s active buyers and sellers is crowded and costly. The agents who compound build the local relationship first, so the buyer they meet today becomes the seller they list in five years and the referral after that.
Before going region by region, it helps to see the size of the state. Massachusetts has 14 counties, and ten of them carry the population.
| County | Population (2020 US Census) | Principal cities |
|---|---|---|
| Middlesex | 1,632,002 | Cambridge (largest), Lowell, Newton, Framingham |
| Worcester | 862,111 | Worcester (largest), Fitchburg, Leominster |
| Essex | 809,829 | Lynn (largest), Lawrence, Haverhill, Salem |
| Suffolk | 797,936 | Boston (largest), Chelsea, Revere |
| Norfolk | 725,981 | Quincy (largest), Brookline, Weymouth |
| Bristol | 579,200 | New Bedford (largest), Fall River, Taunton, Attleboro |
| Plymouth | 530,819 | Brockton (largest), Plymouth, Bridgewater |
| Hampden | 465,825 | Springfield (largest), Chicopee, Holyoke, Westfield |
| Barnstable | 228,996 | Barnstable (largest), Falmouth, Sandwich, Yarmouth |
| Hampshire | 162,308 | Northampton, Amherst, Easthampton |
Where Massachusetts people are moving, and why it cuts both ways
Massachusetts always has a large, active market on both sides. People arrive and people leave every year, and each side is a standing opportunity for the agent who sees it early.
Massachusetts has kept growing, passing 7.1 million residents on a recent run of net gains that includes its largest single-year increase in decades (US Census Bureau, via the UMass Donahue Institute). The composition is the part worth understanding. In a strong recent year, net international arrivals of about 90,000 more than offset net domestic departures of about 27,000, and domestic out-migration has eased from its early-2020s peak to below where it stood in 2019. Greater Boston mirrors the state, with international arrivals near 70,000 outpacing net domestic departures near 24,000. International in-migration is the swing factor that runs hot and cool from one year to the next. The churn on both sides is the constant.
For an agent, that churn is two pipelines, not one. Departures are listings. A family leaving for New Hampshire, a retiree headed to Florida or Maine, a higher-income household weighing the tax picture, each one still owns a Massachusetts home that has to be sold, and each is a relocation referral into another market for a fee. Arrivals are buyers: international newcomers, young professionals concentrating in Greater Boston, and remote-capable households moving toward the Berkshires, the Cape, and the Pioneer Valley. This holds in any year, whatever the net number does.
The scale is easy to underestimate until it touches your own database. Nationally, about 2.1% of Americans move to a different state each year and about 3% move to a different county within their state. Over the years you stay in touch with a past client, the odds that one of them eventually moves out of your market add up, and every one of those moves is a listing you either capture or lose. The agents who win in Massachusetts treat both directions as business, not as a market that is either growing or shrinking.
A high-wage economy broader than biotech
Massachusetts runs on a diversified high-wage base that has held up through cycles, not on a single anchor. Life sciences and biotech get the headlines, but higher education, health care, finance and insurance, defense, and technology all carry weight, and that spread is what keeps demand steady when any one sector turns.
Life sciences is the clearest example of why the cycle matters more than any single year. Massachusetts holds one of the largest concentrations of these jobs in the country, roughly 143,000, and the sector moves in waves. After averaging about 7.8% annual job growth from 2020 to 2022, it cooled, shedding roughly 4,100 biotech jobs in 2025, about 1,800 of them in a single quarter, as venture funding pulled back from an early-2020s peak near $8 billion to about $2.75 billion in the first half of 2025 and lab vacancy climbed above 22% in Cambridge and above 38% in Boston (MassBio; Boston Business Journal). Even in the down leg, the state still drew more than a fifth of all US biotech venture funding, second only to California.

For an agent, the read is not “biotech is up” or “biotech is down.” It is that the inner core around Cambridge, Boston, and Kendall Square rides a cycle that expands, cools, and expands again while the lab space and the talent stay put. A cooling year trims the frenzy at the top of that submarket; it does not empty it. And because health care, universities, finance, and defense keep hiring across the same cycles, statewide demand does not hinge on any one employer’s quarter. The lesson for lead generation is patience with the core and attention to the rest of the state, where the reasons to buy and sell are steadier.
Three policy shifts are changing where Massachusetts listings and buyers show up
Three changes now on the books are quietly redrawing where new supply and buyer demand will appear across Massachusetts, and each one gives an agent a reason to start conversations most competitors are not having yet.
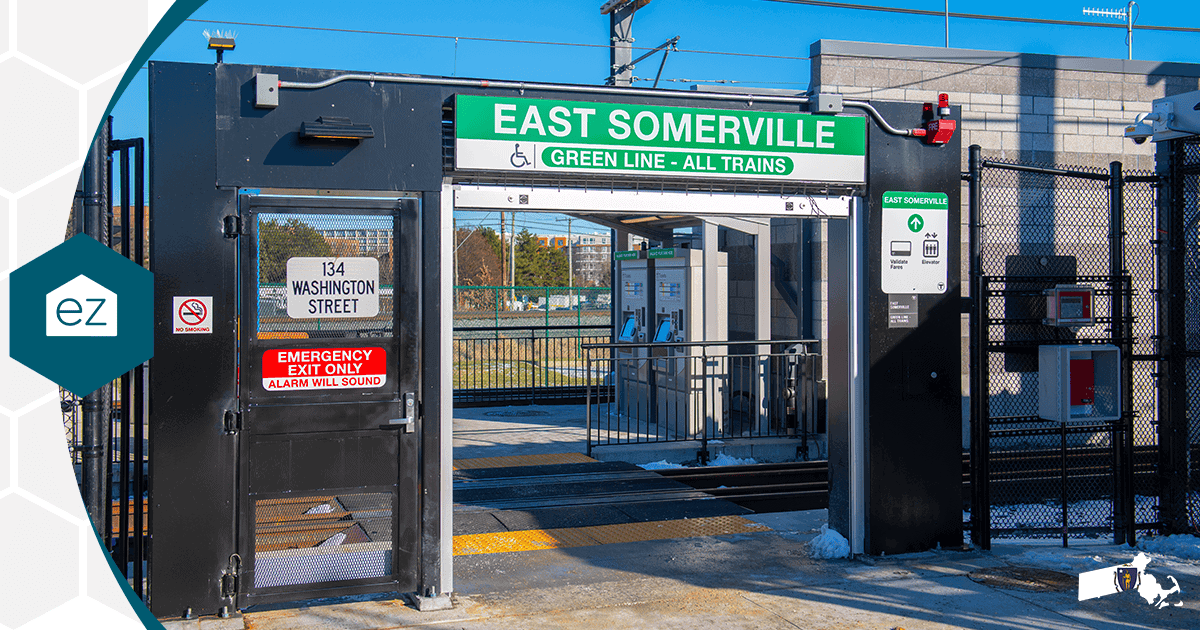
The first is the MBTA Communities Act. It requires 177 cities and towns served by or bordering transit to zone for multifamily housing by right, and the Supreme Judicial Court confirmed in January 2025 that the law is enforceable, so this is a lasting change to where density is allowed. Adoption keeps climbing: as of late 2025 the state had approved plans for more than 100 of the 177 communities, with dozens more in conditional compliance, and the zoning already adopted has created capacity for roughly 487,150 homes near transit, about 62% of it within a half mile of a station (Executive Office of Housing and Livable Communities; 2025 Greater Boston Housing Report Card). The nuance that matters for agents: this is zoned capacity, not built homes, and about 61% of it sits on commercial and industrial land with under 5% on single-family parcels. So over the coming years the new multifamily listings and the buyer demand that follows will concentrate around transit stations and existing density, not in single-family neighborhoods. An agent who knows which stops in the county carry the most new capacity has a real edge.
The second is the by-right accessory dwelling unit. Since 2025, a protected-use ADU under 900 square feet is allowed by right in single-family zones statewide, and homeowners moved fast: in roughly the first half of 2025 alone, owners in about 170 communities filed more than 800 ADU applications and over 550 were approved, with Plymouth, Milton, Worcester, and Newton among the leaders (Executive Office of Housing and Livable Communities). For an agent, that is a standing reason to reopen a conversation with a past client, a senior who wants to age in place with rental income, a family adding space for a parent, an owner sitting on equity who never considered building. Every one of those conversations is about value, financing, and what the home could become, which is exactly the kind of contact that turns into a listing later.
The third is the 4% surtax on income above $1 million. Voter-approved and effective for tax years starting in 2023, with the threshold indexed to inflation, it has become a permanent part of the high-end calculus, and the collections show why it is not going away. Against a conservative budget near $1 billion, it brought in about $2.2 billion in fiscal 2024 and nearly $2.6 billion between July 2024 and April 2025, directed largely to education and transportation (State House News Service; Governing, reading Department of Revenue figures). Because a one-time home or business sale can push a household over the threshold in a single year, the surtax belongs in every luxury seller’s timing conversation. An agent who can speak to it intelligently is more useful than one who cannot, and usefulness at the high end is how listings get won.
Alongside these sit the Affordable Homes Act, signed in 2024 to put up to $5.16 billion toward more than 65,000 homes and the statute behind the by-right ADU, and Proposition 2½, the levy cap that keeps property-tax growth bounded while leaving wide town-to-town rate differences. Together they point to a market where policy, not just price, decides where the next listings come from. That is also why the Massachusetts opportunity gets claimed county by county, and why it is worth knowing early whether your county is still open.
Six Massachusetts markets, six different games
A lead strategy that works in Back Bay will not work in the Berkshires. The regions of Massachusetts run on different prices, different buyers, and different reasons to move, and an agent who treats the state as one market will misread five of its six parts.
Greater Boston is the highest-price, tightest-inventory, most competitive submarket, and the squeeze keeps pushing buyers outward. The trajectory tells the story: the income needed to buy an entry-level Greater Boston home rose from about $97,941 in 2021 to about $162,224 in 2025, up more than 60%, while the share of renters who could afford one fell from roughly 30% to about 15% (2025 Greater Boston Housing Report Card). The $1 million single-family home now spans 36 municipalities, while the sub-$500,000 single-family home has nearly vanished, down from 57 communities in 2015 to just three. Those directions are locked in by how little the region builds, and they are what push demand toward Worcester, the Gateway Cities, and the outer suburbs.
The Cape and Islands run on their own calendar. Barnstable County, plus Dukes and Nantucket, is a seasonal, second-home market where the single-family median has climbed into the high $700,000s, around $790,000, with only about two months of supply, and where days on market lengthened into the 50s as the frenzy cooled without prices breaking (Cape Cod and Islands Association of Realtors). The buyer pool behaves unlike an inland year-round market, and the selling window is compressed, which makes timing and local knowledge the whole game.
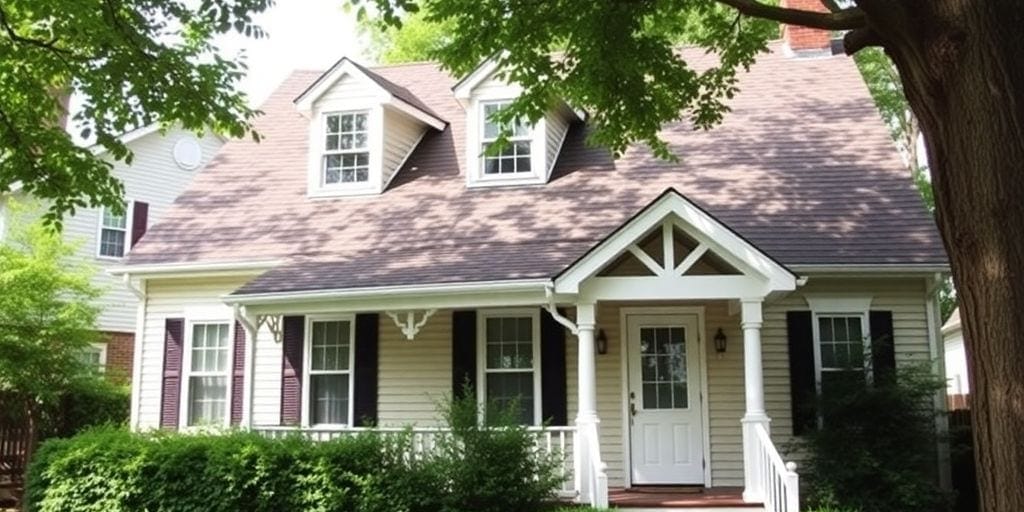
The Berkshires and Western Massachusetts are the state’s affordability-and-second-home valve. Berkshire County single-family volume has risen to about 1,231 sales in a recent year at a countywide average near $499,000, while land sales fell about 22%, a thin construction pipeline that keeps new workforce housing scarce (Berkshire County Board of Realtors). It is a steadier, lower-price market that draws both priced-out locals and second-home buyers from the east.
The Pioneer Valley, spanning Hampden, Hampshire, and Franklin counties, is the state’s affordability floor. Incomes run below the state average and Springfield is priced well below Greater Boston, a gap that has persisted for years (Mass.gov). Central Massachusetts, anchored by Worcester County, is the relative-value alternative that steadily pulls priced-out Boston buyers, with the Worcester median around $443,000, materially below the Boston metro (The Warren Group). And Southeastern Massachusetts, with Bristol County and Brockton, carries the attainable Gateway City tier, where the 26 Gateway Cities have been adding only about 4,000 to 7,000 units a year, roughly 20% behind the pace needed for balance, with the cities west of Worcester furthest behind (MassINC Gateway Cities Housing Monitor).
| Region | The trend that defines it |
|---|---|
| Greater Boston | Highest price, tightest supply; entry-level income need up 60%-plus from 2021 to 2025 and the sub-$500K single-family home down from 57 communities in 2015 to three. |
| Cape and Islands | Seasonal, second-home market; single-family median near $790,000 with about two months of supply as it cools from frenzy without prices breaking. |
| Berkshires / Western MA | Affordability and second-home valve; about 1,231 single-family sales in a recent year near a $499,000 average, with land sales down 22% keeping new supply thin. |
| Pioneer Valley | The state’s affordability floor; incomes below the state average and Springfield priced well below Greater Boston. |
| Central MA (Worcester) | Relative-value alternative drawing priced-out Boston buyers; Worcester median around $443,000. |
| Southeastern MA / Gateway Cities | The attainable tier; Gateway Cities adding 4,700 to 7,300 units a year yet running about 20% behind the pace needed for balance. |
The opportunity runs well beyond the Boston metros
The counties outside the Boston ring are where a lot of the state’s steadier, more attainable business lives, and where a recognized local name still goes a long way. Prices in Western Massachusetts, the Pioneer Valley, and the Gateway Cities sit far below Greater Boston, which means a marketing dollar reaches more homes and a relationship compounds over more transactions.

| County | Communities |
|---|---|
| Barnstable (Cape Cod) | Barnstable, Falmouth, Sandwich, Yarmouth |
| Berkshire (Western MA) | Pittsfield, North Adams, Great Barrington, Lenox |
| Hampden (Pioneer Valley) | Springfield, Chicopee, Holyoke, Westfield |
| Hampshire (Pioneer Valley) | Northampton, Amherst, Easthampton, South Hadley |
| Franklin (Western MA) | Greenfield, Montague, Deerfield, Orange |
| Bristol (Southeastern MA) | New Bedford, Fall River, Taunton, Attleboro |
| Plymouth (South Shore) | Brockton, Plymouth, Bridgewater, Marshfield |
| Worcester (Central MA) | Worcester, Fitchburg, Leominster, Shrewsbury |
Between the metros named earlier and the counties here, the point is the same. Buyers and sellers are spread across all of it, and the agent who owns the relationships in a county is the one they turn to, whichever side of the deal they are on.
The remote-work demand most Massachusetts agents are not pricing in

Here is the edge most agents in the state’s mid-price and lifestyle markets are underusing: the shift the headlines keep calling dead is real, it has held, and it is a buying signal. The “remote work is over” story compares today to the emergency peak of 2020, not to how people actually worked before the pandemic. Measured properly, remote and hybrid work has settled at a level roughly three times what it was pre-pandemic and has stayed there.
The national numbers are steady and come from serious sources. In its most recent readings, the Bureau of Labor Statistics has counted about 36.7 million Americans doing at least some telework, with the telework rate around 23.4%. When the Census Bureau ran its Business Trends and Outlook Survey across roughly 150,000 firms, those employers forecast about the same remote-work level half a decade out. And Pew Research Center put the share of remote-capable employees working from home at least occasionally at around 75%. This is not a fad winding down; it is a settled feature of how a large share of high-earning knowledge workers live.
Apply that to Massachusetts geography and the opportunity is obvious. The Berkshires, the Cape and Islands, the Pioneer Valley, and Central Massachusetts are exactly the affordable, lifestyle, and mid-price regions positioned to keep capturing remote-capable buyers priced out of Greater Boston, which is consistent with the intra-state movement already in the migration numbers. Those buyers want specific things, and an agent who markets to them wins. High on the list is a home office they can close the door on, along with extra square footage, genuinely fast broadband, and a second work space that the newly by-right ADU or a detached outbuilding can supply. A listing described around those features in Lenox, Northampton, or Shrewsbury reaches a buyer who can now live an hour or two from the office and is looking for a reason to choose your town. That is lasting, growing demand hiding in plain sight, and most agents are still marketing to it as if it were 2019.
The lead tactics Massachusetts agents lean on, and where each one hits a wall

In a market with a month and a half of supply, most lead tactics end up competing for the same short list of active buyers and sellers. Each approach below does something real. The question is what each one leaves on the table in a state this tight.
Shared leads from legacy real estate portals bring volume, and volume feels like progress. The catch is in the word shared. That same contact and budget can be sold, or handed to whichever business bids highest, which means the agent is buying a cold name that several other people are calling at the same time, often for a referral fee of 30% to 38% at closing. In Greater Boston, where competition is dense and home values are high, that cost climbs fast, and it buys a contact who never chose you.
An IDX website is a real asset, and the best agents maintain one. But it is slow and expensive to keep fast and current, and it mostly captures people already searching, not the far larger group of owners who are not looking yet. It rarely surfaces the future seller, and on its own it gives an agent no way to stay in front of a buyer long enough to earn their next move.
Cold calling and texting expired and FSBO listings still works for agents who grind it, especially on the Cape, where the selling window is compressed and timing is everything. It also carries real exposure. The moment you prospect by phone or text, the law treats you like a telemarketer, and if a contact disputes consent, the burden is on you to prove it. That risk sits on every unverified number you dial.
Predictive-seller software will score your database and guess who might list. A score is a guess. It is not the trust that turns a name on a list into a signed listing, and building that trust is still on the agent. Generic all-in-one CRMs and do-it-yourself newsletters add one more system to run and pay for, disconnected from anywhere clients actually spend time. And paid search, social ads, and geographic farming all work with a large, sustained budget, which is hard to justify per transaction in the lower-price Gateway City tier where margins are thinner.
None of these is worthless. What they share is a ceiling. They chase the small slice of the market active this month, they buy or rent attention rather than owning a relationship, and they leave the agent starting cold again next quarter. The alternative is a source that surfaces ready buyers and sellers out of a private, returning audience, reading real search-and-activity signals rather than a purchased guess, and keeps the relationship long after the first contact. That is the mechanism the rest of this article is about.
What ez Home Search does differently for a Massachusetts partner

ez Home Search gives one local partner an exclusive, confidential, relationship-first source built to surface ready buyers and sellers and keep the relationship for years. It is one national platform, co-branded to the partner, not a pile of tools to assemble.
It starts with the Exclusive County Partnership. A single agent, team, or brokerage takes a whole Massachusetts county, with their brand on the consumer experience and no rival partner allowed to work that territory. The fee is one predictable number. Nothing is charged per lead, and the commission on a closed deal is never split, so a strong month of business stays a strong month for the partner instead of arriving as a bigger bill. Whether the territory is Middlesex or Worcester, Essex or Norfolk, Bristol or Hampden, Barnstable or Berkshire, the partner owns the position there alone.
Why these connections convert traces back to how the introduction happens. On legacy real estate portals, a person’s contact details and budget go to whichever businesses paid for them, so the agent inherits a cold name that several others are dialing too. ez Home Search runs the opposite model. As The Only Confidential Home Search, it keeps a person’s information from being sold, recycled, or pushed out to a crowd, and it pairs each buyer or seller with a Single Local Expert who guides them. That is how ez Home Search delivers A Better Way To Discover Real Estate, and it changes what lands in the agent’s inbox. Instead of a shared lead, the partner meets someone who already trusts the platform and has shown real intent through real activity, which is why these connections tend to convert on the order of 30 to 60 days rather than dragging out or dying on the vine.
That model also answers the problem the opener named. Because ez Home Search serves the whole arc of owning a home, not just the moment of a sale, it reaches the 90 to 95% of residents who are not buying or selling today: the owner watching their equity with an automated valuation model (AVM), the family a few years from a move, the buyer just starting to look. It keeps them engaged with home-value updates, school and tax research, and a confidential search they return to on their own, and it shows the partner who is heating up before anyone else sees it. The partner does not just receive a buyer and hope. They capture that buyer, keep the relationship, and hold the tools to turn today’s buyer into the seller they list years from now and the referrals that follow.
From there, the parts of the model map straight onto the Massachusetts pains named above.
In a tight market, the biggest and cheapest source of new business is the database a partner already owns. Most agents let their past clients and sphere go quiet; ez Home Search brings that book back to life, co-branded and run for the partner, at a reactivation clip of 2.5 to 5 times the market rate, with home-value updates, listing alerts, and a search experience that draw people back on their own. When a policy change like the by-right ADU gives a rate-locked owner a reason to re-engage, the co-branded home-value page is what they open, and the partner is the name attached to it.
The two-sided migration in the state is another beat the model captures. When a Massachusetts client starts searching a new state on the co-branded national platform, the partner sees the signal early, keeps the local listing they earned rather than losing it to a portal, and refers the client into the new market for a fee. Without national coverage, that move is a silent, total loss. With it, the home the agent helped the client buy stays the home the agent sells.
The co-branding does more than generate business. Across the search, the alerts, and the market updates, it builds the partner’s own brand across a whole county, so local buyers and sellers come to associate one name with real estate in the area long before anyone picks up the phone. Compliance is handled too. Before the agent dials, ezVerify.ai has already logged the opt-in, saved the recording that documents it, run the number against a known-litigator database, and dropped anything on the Do Not Call list, and it rounds out the contact record the agent would otherwise piece together by hand. The riskiest part of prospecting is off the table. And the conversion tools that turn interest into closings are already built and running as part of the platform, included in the one fee, so the partner never has to configure or operate them.
Securing a Massachusetts county before it is taken
Only one partner holds a county, and Massachusetts counties come off the board one at a time. That is the whole point of an exclusive model, and it is why the position is worth holding.
The state has 14 counties, and demand for the recognized local position tends to run ahead of what is open, with more territory claimed every month. The model behaves the same in a dense metro like Middlesex or Suffolk, a mid-size market like Worcester or Hampden, and a seasonal or rural county like Barnstable or Berkshire. A small county rewards the trusted local name every bit as much as a large one does. What a partner cannot do is share a county. Once it is taken, no competitor can hold the same co-branded position from the outside, no matter what they spend.
The setup is not a project. The partner walks into a platform that already has millions of users, now carrying their name, and it works from day one. There is no stack to assemble, no data to source, and no engineering to run, because ez Home Search runs everything behind it. The fastest way to know where you stand is to check whether your Massachusetts county is still available.
The choice a Massachusetts agent is actually making
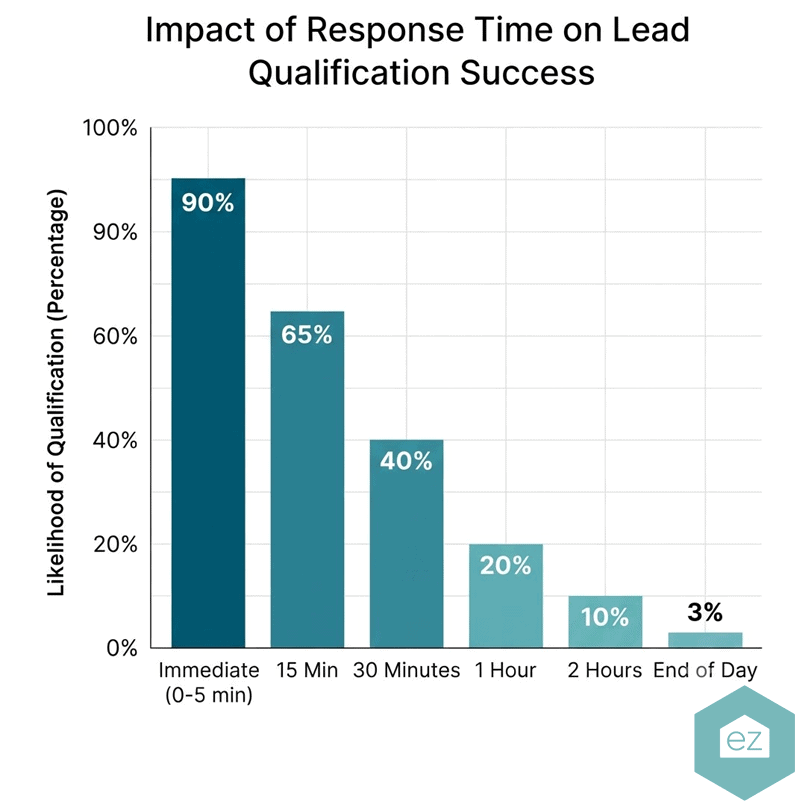
Strip away the detail and a Massachusetts agent is choosing among three ways to generate listings and leads.
The first is to keep buying shared leads from legacy real estate portals and competing for the same handful of sellers with everyone else who bought the same names. It produces activity, but the cost climbs and the relationships never really belong to you. The second is to build the whole thing yourself, the national search platform, the data, the compliance, the reactivation engine, which no single team or brokerage can actually afford or maintain. The third sits between them: hold an exclusive Massachusetts county and let a confidential, relationship-first source surface ready buyers and sellers and reactivate the database you already own.
That middle path is the reasonable one, and it comes with an honest trade-off. The model compounds over the years a partner holds the county, so it rewards an agent who commits to a market rather than one chasing a single lead this week. If you want a name to dial tomorrow, a shared portal lead is faster. If you want to own the client relationships in your county for years, this is the better structure.
The proof is in the part most agents leave on the table. ez Home Search brings a partner’s past clients and sphere back at a rate of 2.5 to 5 times the market, which in a tight market is where a steady flow of both buyers and listings comes from. The win in Massachusetts is not this month’s active client; it is being the local name the next thousand of them trust. The partner who owns the county and the relationships owns that pipeline. Check whether your Massachusetts county is still available, and start there.
Frequently asked questions
Where do Massachusetts sellers actually come from when only about a month and a half of inventory is on the market?
They come from relationships built long before the sale, not from a fresh batch of purchased leads. In a market this tight, the sellers are homeowners with a life reason to move, a job change, a growing or shrinking household, a relocation, an equity decision, and they most often list with an agent they already know or were referred to. The same relationship that helps someone buy today produces the listing when they sell years later, which is why a reactivated database and a recognized local name outperform buying shared leads here. ez Home Search is built to surface those owners out of a private, returning audience, reading real activity signals like a home-value check or a search picked back up, and it lifts a partner’s reactivation of past clients to 2.5 to 5 times the market rate.
How do agents find listing leads in Greater Boston when so few owners are selling because of low locked-in mortgage rates?
The lock-in effect means fewer owners move on impulse, so the agents who win are the ones already in front of an owner when a real reason to move arrives. New shared leads are an expensive, cold way to try to catch that moment. You become the first call by staying present in an owner’s life through a co-branded home search, value updates, and listing alerts. It also surfaces the early signals, a second valuation, a saved home revisited, that show which contacts are getting close.
Does the 4% Massachusetts surtax on income over $1 million change how luxury sellers time a sale, and how should an agent handle that conversation?
It can, because a one-time home sale can push a household over the $1 million threshold in a single year, and the surtax has become a permanent part of the high-end calculus. An agent does not give tax advice, but an agent who understands the surtax, and who works alongside the client’s tax professional on timing, is more useful than one who is caught flat-footed by the question. At the high end, being that useful is how listings get won, and it is the kind of conversation the recognized county name is expected to handle.
How is the MBTA Communities Act changing where new listings and buyer demand will show up in Massachusetts suburbs?
The law has zoned capacity for roughly 487,150 homes near transit across the communities that have adopted it, with about 62% of that within a half mile of a station, and most of the capacity sits on commercial and industrial land rather than single-family lots. That means new multifamily supply and the buyer demand around it will concentrate near transit stops and existing density over the coming years. For an agent, knowing which stations in your county carry the most new capacity is a way to be early to both the listings and the buyers that follow.
What is the best way to generate seller leads in the seasonal Cape Cod and Islands market?
The Cape and Islands market runs on a compressed calendar and a second-home buyer pool that behaves unlike an inland year-round market, so timing and local knowledge decide who wins. The most reliable seller leads there come from staying connected to owners year-round, many of whom live elsewhere, so that you are present when they decide to sell rather than scrambling during the short listing window. A co-branded home search and value-tracking experience keeps a partner in front of those owners across the off-season, which is exactly when the decision to list next season gets made.
Where are the more affordable buyer leads in Massachusetts, in Gateway Cities like Worcester, Springfield, New Bedford, and Fall River?
The Gateway Cities carry the state’s attainable price tier and a higher-volume, lower-price segment, which is real opportunity but harder to justify heavy paid-lead spend against. Worcester’s median has run around $443,000, well below Greater Boston, and the Pioneer Valley sits below the state average. The economics favor a source with no charge per lead and a co-branded experience that builds a recognized name across the whole county, so the marketing cost is spread across many transactions rather than paid per contact. That is where an exclusive county model fits the Gateway tier better than buying shared leads one at a time.
If a past client relocates from Massachusetts to New Hampshire, Maine, or Florida, how does an agent keep the Massachusetts listing?
The key is catching the move while the Massachusetts home is still yours to list. When a client starts searching another state on a co-branded national platform, the partner picks up that activity early, opens the conversation about selling the Massachusetts home before it lists with anyone else, and hands the client off to a vetted agent in the destination market for a referral fee. Without national coverage, the client quietly opens a legacy portal, connects with a stranger, and the local listing is gone before the agent knew the move was happening. Coverage is what turns a relocation from a total loss into two pieces of business.
How do widely varying town property-tax rates across Massachusetts affect what buyers will pay, and how should agents factor that into pricing a listing?
Under Proposition 2½, residential rates still vary widely from one town to the next, and a buyer carries those taxes on top of the mortgage and insurance, so a high tax rate can quietly hold down what a home sells for. A well-priced listing reflects more than comparable sales; it factors in the town’s tax rate and what a buyer can actually afford at a given monthly payment. An agent who can show a seller how the local tax rate shapes their realistic buyer pool prices more accurately and spends less time chasing the market down.