

Wisconsin turns over roughly 4% of its owner-occupied homes in a given year. That ratio governs everything about Wisconsin real estate leads. The owner who signs a listing agreement next year already owns a Wisconsin home this year, has raised no hand, and is invisible to every lead source on the market. Add 72 counties that build, price, and turn over at rates with nothing to do with each other, and one statewide playbook becomes a guess across most of the state.
Wisconsin closes tens of thousands of homes every year, with an owner base well over a million households behind them. What most agents lack is arrival time. They meet these people in the last few weeks of a process that ran for years.
Where Wisconsin builds homes has little to do with where people currently live
Wisconsin’s building activity does not track its population, and the gap is not a rounding error. Milwaukee County holds more residents than any other county in the state, 926,331 of them, and it authorizes fewer new single-family homes in a year than several counties a fraction of its size. In 2025 it issued 199 single-family permits, down from 430 in 2024. Dane County, with roughly 62% of Milwaukee County’s population, issued 1,398 that year, up 23.0%.
Other counties widen the gap rather than close it. Waukesha County issued 1,003 permits in 2025, up 35.0%. St. Croix County, home to 96,033 people, issued 536, up 20.7%, which is more than two and a half times Milwaukee County’s total on roughly a tenth of the population. Those counts come from the Wisconsin Builders Association’s county report, built from the filings municipalities send the Wisconsin Department of Safety and Professional Services under 2015 Wisconsin Act 211. The ordering is not a one-year fluke either; it has held across the last decade.
Lead vendors sell the same product into all 72 counties, and most agents run the playbook they were trained on regardless of which county they work. A pricing instinct that is right in Waukesha County is off by a factor of two and a half in Clark County. That is how an agent works harder every year and watches the pipeline sit flat.
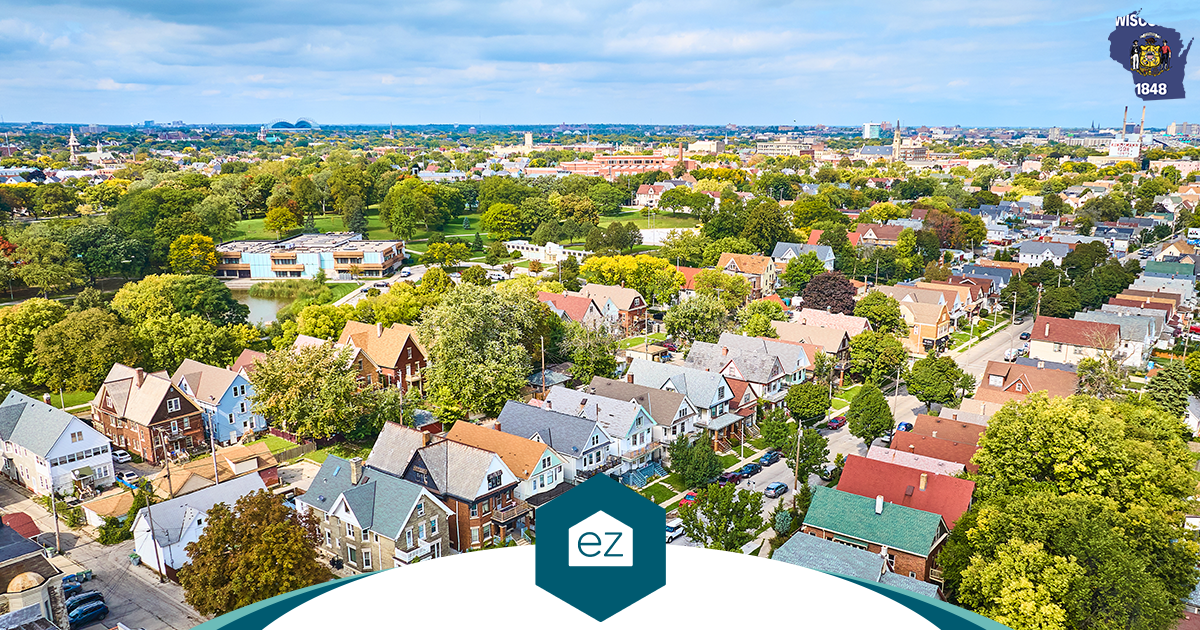
Wisconsin keeps producing home sales, even in years when few homes are for sale
Wisconsin has closed tens of thousands of existing homes every year for two decades. The recent direction is up. Sales rose in 2024 and again in 2025, finishing that year at 69,132, a 2.0% gain over 2024’s 67,771 and a second consecutive year of growth, according to the Wisconsin Realtors Association. The statewide median finished 2025 at $325,000, up 4.8% from $310,000, which Tom Larson, the association’s president and chief executive, noted in January 2026 was the slowest annual price appreciation Wisconsin had recorded since 2017.
Every region grew. Sales rose 6.7% in the North, 3.7% in the Northeast, 3.0% in the West, 1.6% in the South Central, 0.4% in the Central, and 0.2% in the Southeast, and median prices rose in all six. Amy Curler, the association’s 2026 board chair, said that January: “It’s good to see a second straight year of improved sales in the Wisconsin housing market.”
The longer series matters more than any single year of it. Wisconsin ran above 82,000 closings in both 2018 and 2019, then climbed to roughly 89,000 in 2020 and near 90,000 in 2021, years when the Wisconsin Housing Affordability Index sat above 200. Volume gave back 14.6% in 2022 and another 17.5% in 2023 as mortgage rates climbed, and it has grown in both years since. That is a rate cycle working itself out. Nothing across the decade shows demand leaving the state.
One distinction decides whether an agent reads any of it correctly. Months of supply, which stood at 2.9 statewide in December 2025 against 3.0 a year earlier, counts what is available for sale on one particular day. Closed sales measure deals completed across a whole year. An agent who treats a short list of active listings as proof the business has gone will be wrong about the year.
Volume also concentrates. Across the twelve months ending December 2025, Wisconsin recorded 26,103 sales between $200,000 and $349,999, 17,087 between $350,000 and $499,999, 13,323 at $500,000 and above, 9,512 between $125,000 and $199,999, and 3,107 under $125,000. Homes sold in an average of 76 days that December, against 78 a year earlier. Any farm built without knowing which of those bands a county actually lives in is a farm built on a guess.
Wisconsin has no shortage of people making moves. Most agents are simply nowhere near those closings until the last few weeks of each one.
Roughly four in five Wisconsin buyers are also sellers, so one-sided prospecting leaves most of the market untouched
Most agents split prospecting in half and lose the larger side. The listing half gets mailers, door knocking, and expired calls. The buyer half gets bought leads. That is two campaigns and two budgets aimed at what is usually one person making one move.
The sizing settles it. Nationally, first-time buyers made up 21% of purchases. That figure comes from the 2025 Profile of Home Buyers and Sellers, a National Association of Realtors survey covering July 2024 through June 2025. No reading has been lower since the association started tracking the share in 1981, and the typical first-time buyer in that survey was 40 years old, the oldest the series has recorded. David Clark, economist for the Wisconsin Realtors Association, framed the shift for a Wisconsin audience in June 2026: “It hasn’t been unusual in previous years to find first-time buyers accounting for more than 40 percent of home purchases in a given year.”
Run that forward. If about one buyer in five owns no home yet, about four in five already own one. Those people are buyers and sellers inside a single move, and nearly all of them begin on the buy side, months or years before any listing agreement exists. Whoever proves useful during that stretch earns the listing later by default, because nobody else was there.
Wisconsin makes the math concrete. The Census Bureau’s 2024 American Community Survey puts 67.8% of the state’s occupied homes in owner hands, above the national 65.2%. Against an owner base well over a million households, 69,132 closings works out to roughly 4% turnover in a year. The owner who signs a listing agreement in any given year already owned a Wisconsin home the year before, and the year before that. Demand is stacked behind them too. Forward Analytics reported in May 2026 that about 13% of Wisconsin residents aged 25 to 34 live with a parent or in-law. None of that appears in a lead feed.
That leaves Wisconsin with three groups rather than two. First-time buyers own no home yet and need affordability and education more than equity math. The dual majority is trading up, down, or across, and needs the equity in the home they are leaving and the timing between the two sides handled as one transaction. Seller-only owners are the smallest of the three: an estate settling a house, a landlord getting out, an owner moving in with a son or daughter.
ez Home Search is built for the person who is both. It watches what someone actually does, a second valuation on the same address, an old search reopened, an alert clicked the morning it lands, and it works whichever side of the move is live instead of guessing. Home-value tracking keeps the partner in front of an owner through all the years when nothing is listed, which is how a buyer served in 2026 becomes a listing in 2029.
If that is the half of the market you have been leaving alone, the first thing worth checking is whether your Wisconsin county is still open.
What is actually moving Wisconsin households between homes
No single story explains Wisconsin’s transaction volume, and an agent who bets a year of prospecting on one will be wrong across most of the state’s 72 counties. At least nine forces are in play, and several of them pull against each other.
Money loosened, slowly. The 30-year fixed rate ran 6.72% in December 2024 and 6.19% in December 2025 (Freddie Mac, via the Wisconsin Realtors Association), and the Wisconsin Housing Affordability Index rose 1.5% over that span to 134. Set that against 2020 and 2021, when the index sat above 200, and the shape is clear. The market got much harder, then started to ease. Every tenth of a point decides whether an owner holding a 3% mortgage is willing to trade it.
Inventory has climbed since late 2023. The Wisconsin Realtors Association began tracking annual inventory change in January 2016, and total inventory fell in nearly every month through September 2023 before reversing. Growth averaged 14.8% across 2024 and 9.7% across the first ten months of 2025. Months of supply averaged 2.5 in 2022, 3.0 in 2023, 3.5 in 2024, and 3.9 across the first ten months of 2025. That is a multi-year recovery.
Wisconsin is gaining residents from other states, which it had not done for two decades. Net domestic migration ran 5,828 in 2024 and 6,984 in 2025, per Census Bureau estimates, a fourth consecutive positive year. Mark Sommerhauser of the Wisconsin Policy Forum put it this way in March 2026: “These aren’t huge numbers of people, but it is a shift.” Both directions matter to a book of business. A family leaving is a listing and a referral fee; a family arriving is a buyer who has not chosen anyone yet.
International arrivals fell sharply, which slowed overall growth. Arrivals from abroad dropped from 19,395 in 2024 to 7,260 in 2025, and statewide population growth slowed from 26,818 to 15,619. Milwaukee County’s international arrivals went from 5,688 to 1,973, and Dane County’s from 4,404 to 2,049. Every state moved the same direction over that period.
Manufacturing is shrinking through retirement. Wisconsin’s manufacturing workforce went from 461,100 in January 2025 to 451,600 in January 2026, a loss of roughly 9,500, per Bureau of Labor Statistics figures compiled by the Federal Reserve Bank of St. Louis. Industry leaders attribute most of it to workers aging out rather than to layoffs. A retirement turns into a housing decision far more often than a layoff does.
Health care and hospitality absorbed the shift. Health care employment reached a new high of 324,200 in 2025, and leisure and hospitality finished the year at 285,200 after recovering nearly all of the roughly 50% drop it took during the pandemic, per the Wisconsin Department of Workforce Development.
Data centers landed in the southeast. Microsoft completed its first Mount Pleasant facility in Racine County in May 2026, more than a million square feet, with roughly 550 full-time staff on site and about 800 expected once a second building runs. That first build phase employed nearly 10,000 construction workers across about two years. Meta broke ground in Beaver Dam in Dodge County in November 2025, and Vantage Data Centers is developing a campus at Port Washington in Ozaukee County.
Tourism set a fourth straight record. Wisconsin logged more than 117 million visits and $27 billion in total economic impact in 2025, up $1.2 billion from 2024, per the Department of Tourism. Sauk County passed $2 billion, Brown County set a record at $1.5 billion, and Door County rose 5%.
The working-age population is contracting. Wisconsinites aged 25 to 64 declined by more than 25,000 between 2020 and 2024, per Forward Analytics in May 2026. That pulls demand toward move-up, downsize, and second-home activity and away from first-time household formation.
Nine forces run across six regions and 72 counties. The agent who knows which three are live in their own county holds an advantage no lead vendor sells.

Wisconsin’s six market regions run on different engines
The Wisconsin Realtors Association divides the state into six regions, and in 2025 the spread between them was wide enough that a lead plan built for one is close to useless in another. The Southeast closed 24,001 homes and grew 0.2%. The North closed 6,793 and grew 6.7%. Median prices ran from $255,000 in the Central region to $380,000 in the South Central. Those regions shared the same year, the same state, and the same mortgage rates.
| Region | 2025 sales | Sales change | 2025 median | Median change | What set it apart in 2025 |
|---|---|---|---|---|---|
| Southeast | 24,001 | +0.2% | $340,000 | +6.3% | Largest region by volume and the least affordable; the Milwaukee metro’s home price to income ratio ran about 5.2, the highest in the Midwest |
| South Central | 13,807 | +1.6% | $380,000 | +5.6% | Highest median in the state; the Madison metro averaged 61.2 housing starts per 1,000 households from 2015 to 2025 |
| Northeast | 13,318 | +3.7% | $305,000 | +7.0% | Fastest median price growth of the six; Brown County tourism reached a record $1.5 billion |
| North | 6,793 | +6.7% | $285,000 | +5.6% | Fastest sales growth in the state, tracking second-home demand across the Upper Midwest lake country |
| West | 6,475 | +3.0% | $307,000 | +2.0% | St. Croix County sales rose 10.5% on a $389,900 median, along the Twin Cities commuting edge |
| Central | 4,738 | +0.4% | $255,000 | +4.1% | Most affordable region and the flattest sales year |
Sources: Wisconsin Realtors Association, December 2025 report; Moody’s Analytics data via a New York Times analysis reported by Wisconsin Public Radio, May 2026; Wisconsin Department of Tourism, June 2026.
Read down the sales column and the point lands. Dane County by itself closed 6,635 homes in 2025, more than the entire Central region. Milwaukee County closed 9,449, more than the North region and more than the West. Yet the North grew faster in 2025 than either the Southeast or the South Central, on the back of counties an agent in Waukesha has probably never worked: Sawyer up 18.6%, Polk up 16.5%, Burnett up 12.3%, Oneida up 11.4%, Bayfield up 10.3%.
Supply behaves differently too. In December 2025 Wisconsin’s metropolitan counties held 2.6 months of inventory, micropolitan counties 3.2, and rural counties 3.9. An agent in Rhinelander and an agent in Brookfield are pricing into two different levels of competition on the same day.
Timing splits as well, and this one is measurable. David Clark, the professor emeritus of economics at Marquette University who consults for the association, applied seasonal adjustment to Wisconsin prices across January 2005 through December 2025. Homes closing between December and February sold at roughly a 5.9% discount. Homes closing in June, July, and August carried roughly a 6.4% premium. That is a 21-year pattern rather than a one-year quirk, and it is worth a real conversation with a seller weighing a February listing against an April one.
The building gap between Milwaukee, Dane and Waukesha counties changes who your next client is
Dane County holds about 62% of Milwaukee County’s population and consistently permits several times as many new single-family homes. The gap is a decade old and it is wide. Across 2015 to 2025 the Madison metro averaged 61.2 annual housing starts per 1,000 households while the Milwaukee metro averaged 17.9, per Moody’s Analytics figures analyzed by the New York Times and reported by Wisconsin Public Radio in May 2026. The 2025 county counts came in at 1,398 against 199.
Kurt Paulsen, professor of urban planning at the University of Wisconsin-Madison, told WPR that production in both regions sits well below its 1990s and early 2000s level, and that the Milwaukee metro still carries a high shortfall in housing production. Waukesha County sits between the two, with 1,003 permits in 2025.
The divergence has a long tail. In 2018, Dane County and the city of Madison passed Milwaukee County and the city of Milwaukee in total equalized property value for the first time in state history. Over the three decades leading to that crossover, Dane County’s equalized value climbed 526% against Milwaukee County’s 178%, per the Wisconsin Policy Forum in August 2018.
Scarcity carries its own price effect. Median home values in the city of Milwaukee rose 138% between 2016 and 2026, second among large US cities, while Wisconsin ranked 13th among states for home-price growth over the decade, per a 2026 Construction Coverage study. Report author Jonathan Jones noted that Milwaukee started from a relatively low price point and that the scale of the appreciation points to sustained demand and growing competitiveness over time.
For a working agent the consequence is concrete. In Dane and Waukesha counties, a real share of the transactions three years out has not been framed yet, so builder relationships and new-construction search behavior belong in the pipeline. In Milwaukee County, nearly every transaction three years out is an existing home whose owner is living in it today. There the owner database is the pipeline, and staying in front of those owners between moves is the whole job.
The same question applies down the list of Wisconsin’s largest counties, each with its own build rate, price level, and principal city.
| Rank | County | Population | Principal city |
|---|---|---|---|
| 1 | Milwaukee | 926,331 | Milwaukee |
| 2 | Dane | 572,674 | Madison |
| 3 | Waukesha | 411,762 | Waukesha |
| 4 | Brown | 270,892 | Green Bay |
| 5 | Racine | 197,532 | Racine |
| 6 | Outagamie | 192,826 | Appleton |
| 7 | Winnebago | 171,769 | Oshkosh |
| 8 | Kenosha | 168,438 | Kenosha |
| 9 | Rock | 164,350 | Janesville |
| 10 | Marathon | 138,403 | Wausau |
Population source: US Census Bureau, American Community Survey 5-Year Estimates, 2024.
Brown County permitted 679 single-family homes in 2025 and Outagamie 453, the two Fox Valley and Green Bay engines. Racine County permitted 296, down 20.9% even as data-center construction moved into Mount Pleasant. Rock County permitted 269 and Winnebago 285. No two of those counties are handing an agent the same year.

Wisconsin counties outside the big metros carry more opportunity than most brokers know
Close to half of Wisconsin’s home sales happen outside the Milwaukee and Madison regions. The Northeast, North, West, and Central regions together accounted for about 45% of the statewide total in 2025, or 31,324 homes. That is nearly half the market, spread across the Fox Valley, the Northwoods, the Driftless Area, the Coulee Region, the Chippewa Valley, the Door County peninsula, the Kettle Moraine, and the Lake Superior shore.
The North region grew fastest in 2025, and the growth sat in counties most metro agents have never worked. Sawyer County sales rose 18.6% on a $340,000 median. Polk County rose 16.5%, Burnett County 12.3%, Oneida County 11.4% on a $375,000 median, and Bayfield County 10.3%. Door County permitted 274 single-family homes in 2025, up 66.1% from 165, in a county that closed 763 existing-home sales the same year.
Property values rose fastest in the far north of the state. Wisconsin’s total equalized value rose 8% in 2025, and the two largest county increases were Florence at 17.84% and Iron at 17.77%, per the Wisconsin Department of Revenue in August 2025. Florence County has 4,646 residents and Iron County has 6,210. Two of the smallest counties in Wisconsin saw their total property value climb at more than twice the statewide rate.
Buyers purchasing second homes account for much of that demand. Nationally, mortgaged second-home purchases fell roughly 66% from their 2021 peak, from 257,547 to 88,158 in 2025, while new construction in second-home areas held at an all-time high, which points to buyers paying cash and never appearing in mortgage data at all. That analysis of Home Mortgage Disclosure Act filings and National Association of Home Builders construction data, published in July 2026, names the Upper Midwest lake country anchored by Vilas County among the country’s concentrated second-home geographies, with Chicago the primary feeder market into the Wisconsin Northwoods.
| County | 2025 sales | 2025 median | Communities |
|---|---|---|---|
| Door | 763 | $447,000 | Sturgeon Bay, Sister Bay, Fish Creek, Egg Harbor |
| Vilas | 534 | $425,500 | Eagle River, Boulder Junction, St. Germain, Land O’ Lakes |
| Oneida | 723 | $375,000 | Rhinelander, Minocqua, Three Lakes, Lake Tomahawk |
| Sauk | 825 | $322,500 | Baraboo, Reedsburg, Spring Green, Sauk City |
| St. Croix | 919 | $389,900 | Hudson, New Richmond, Somerset, Roberts |
| Walworth | 1,559 | $389,900 | Elkhorn, Lake Geneva, Delavan, Whitewater |
| Barron | 874 | $280,000 | Rice Lake, Barron, Cumberland, Chetek |
| Bayfield | 279 | $328,000 | Washburn, Bayfield, Cable, Iron River |
| Vernon | 260 | $278,000 | Viroqua, Westby, La Farge, Hillsboro |
| Waupaca | 567 | $262,500 | Waupaca, New London, Clintonville, Weyauwega |
Source: Wisconsin Realtors Association, December 2025 report.
The western edge runs on a different clock again. St. Croix County permitted 536 single-family homes in 2025, third-most of any Wisconsin county, on a population of 96,033, with Pierce County adding 180. Hudson, River Falls, New Richmond, Prescott, and Ellsworth are absorbing households whose paychecks come from Minnesota. Down the Mississippi, La Crosse County closed 1,333 homes and Eau Claire County 1,219, with Onalaska, Holmen, Chippewa Falls, and Menomonie carrying the surrounding demand. Hayward and Minocqua run on summers.
Every one of those markets is somebody’s whole business. None of them responds to a Milwaukee playbook.
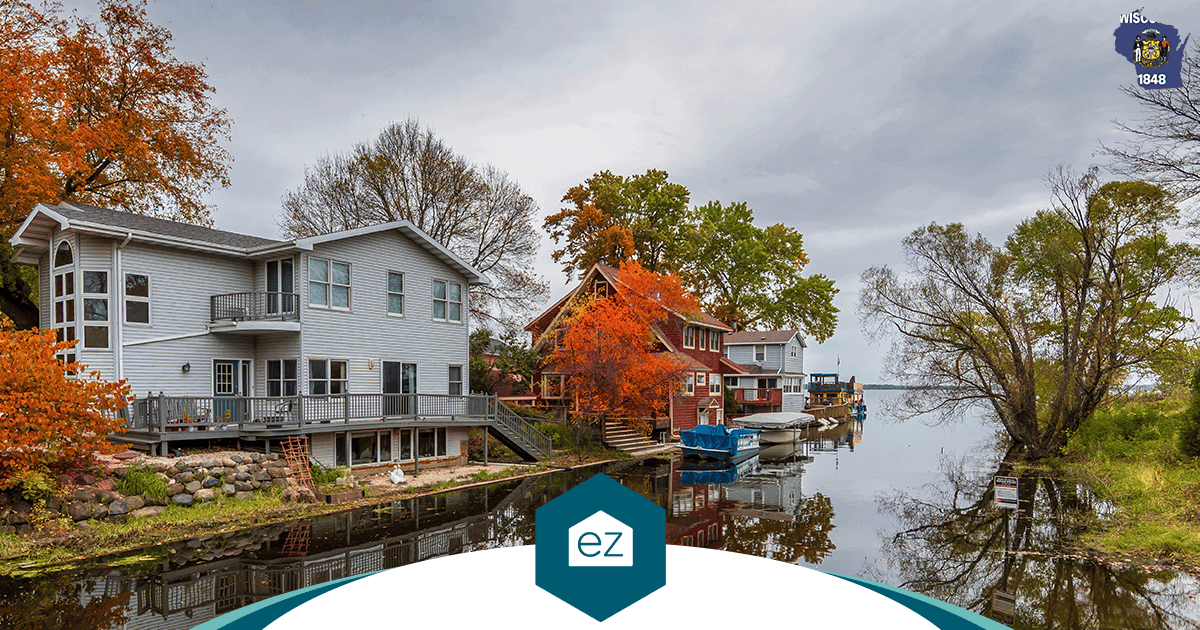
The real data on remote and hybrid work fundamentally unlocks Wisconsin’s smaller counties
Wisconsin’s share of workers who primarily work from home more than doubled from 2019 to 2024, and it has not gone back. The Census Bureau’s American Community Survey one-year estimates put 5.10% of Wisconsin workers primarily working from home in 2019 and 11.81% in 2024, a gain of 6.71 percentage points that ranks the state 28th nationally. The national figures moved the same direction over the same years, from 5.72% to 13.32%.
Plenty of agents have written this off, because the headlines measure against spring 2020 rather than against 2019. Measured against 2019, the shift holds. A 2026 study in the Bureau of Labor Statistics’ Monthly Labor Review followed a single cohort across four decades of working life. It found telework adoption rising incrementally long before 2020, intermediate levels of telework becoming common around 2018, and the share of workers who reported no telework, or only minimal telework hours, never returning to pre-pandemic levels. BLS reads that as “suggesting a structural shift toward more widespread telework adoption.” Employers say much the same about their own plans. When the Census Bureau surveyed roughly 150,000 firms for its Business Trends and Outlook Survey, those firms projected remote work five years ahead at close to the level they were already running.
For Wisconsin, that lands in specific places. A household that no longer commutes daily can buy in Vilas, Oneida, Sawyer, or Bayfield County and keep the same paycheck. The same holds in Vernon, Crawford, and Richland counties in the Driftless, in Marathon, Portage, and Wood counties through the middle of the state, and across the Chippewa Valley. St. Croix and Pierce counties have run on this logic for years with Minnesota paychecks. The pattern shows up in the sales column too: the North region grew 6.7% in 2025 against the Southeast’s 0.2%, and Wisconsin has now posted four straight years of positive net domestic migration.
It also changes what a buyer asks for at a showing. They want a dedicated room with a door that closes, and enough space that two working adults are not sharing a kitchen table. Many ask about a detached structure, an accessory dwelling unit, or anything with its own entrance, which in a lot of Wisconsin counties already exists as a heated garage loft or a converted outbuilding. Square footage matters more to them than walkability. And they want broadband that holds a video call, which an agent should be able to answer for a specific address rather than for a township.
Wisconsin ranks 28th in the country on this measure, which means that buyer is still arriving in most of its counties rather than already competing there. That is an opening.
Rising Wisconsin property tax bills are a listing conversation most agents skip
A Wisconsin homeowner with no plans to move still opens the December tax bill, and that is a conversation an agent can own without paying anyone for it. Gross property taxes levied in 2024 for collection in 2025 came to $13.65 billion statewide, against $10.45 billion in state income tax collections and $7.83 billion in sales tax collections in fiscal 2025, per the Wisconsin Department of Revenue. Property tax is the largest tax most Wisconsin families pay.
It is also climbing. The Wisconsin Policy Forum reported in December 2025 that gross statewide levies were on pace to rise roughly 5% in 2026, after 4.4% the year before, the largest increase in 18 years. Gross K-12 school levies rose 7.8% on December bills, adding about $476.1 million to reach roughly $6.58 billion, the biggest jump since 1992. County levies rose 2.9% to about $2.63 billion.
The part most owners get wrong is the rate. Wisconsin’s average gross property tax rate fell from 2.3067% in 2000 to 1.5029% in 2024. Bills rose anyway, because the base underneath them more than tripled over those years, from $286.3 billion in total statewide equalized value in 2000 to $982.8 billion as of January 1, 2025. Of the $75.4 billion added in the most recent year, $60.5 billion came from market value increases and $15.2 billion from new construction. The residential class alone rose $57.1 billion to $724.4 billion.
The machinery is unusually local, which is why a statewide answer never satisfies anybody. The Wisconsin Department of Revenue counted 3,202 units levying property tax out of 3,404 total in its October 2025 property tax overview, covering 421 school districts, 16 technical college districts, 72 counties, 1,913 municipalities, and 537 special districts. Most of the state pays in two installments, due January 31 and July 31. Some municipalities allow three to seven, and in the City of Milwaukee an owner can pay in as many as ten. The same report puts the Lottery and Gaming Credit at an average of $241 per primary residence in the 2024-25 tax year and the First Dollar Credit at $64.
An agent who can walk an owner through their own number is the agent that owner calls when the move finally arrives. That is part of what ez Home Search hands a county exclusivity partner. Property taxes can be looked up and compared by state, county, city, and ZIP. An automated valuation model (AVM) tracks the home’s value month to month, so an owner can see what their assessment is being set against. The Single Local Expert behind the experience turns both into a comparative market analysis, plus a straight answer on whether the tax picture is holding the price down, which it can, because a buyer has to carry that bill on top of the mortgage and the insurance.
Every one of those conversations happens years before a listing exists. That is the point of them. If you would rather be having them in your county than watching someone else have them, check whether your Wisconsin county is still open.
The eight places Wisconsin real estate leads come from, and where each one runs out
Each of the eight works, which is exactly why picking among them by feel goes wrong so often.
Start with the denominator. The Wisconsin Realtors Association represented more than 15,000 members statewide as of January 2026, and Wisconsin closed 69,132 homes in 2025. Spread evenly, that comes to fewer than five closings per member for the year, and it is never spread evenly.
Then look at how people choose. National Association of Realtors research on buyers and sellers puts the numbers plainly: 81% of sellers talk to a single agent before they pick one, and 77% of repeat buyers interview exactly one. Reputation decides it for 35% of sellers, and referral brings buyers and sellers to an agent more often than any other source. Most Wisconsin listings are never won in a competition. They are won before one starts, by whoever was already the name in that household’s head.
The standard menu runs like this.
Shared portal leads deliver real volume and the fastest way into a new market. The same contact also goes to several agents at once, the consumer chose none of them, and the race is to dial first. An agent buying those is buying a starting gun. The relationship is still ahead of them.
A self-built IDX site creates a genuinely owned asset, and the instinct behind it is correct. It is also slow to rank, expensive to keep current against county-level data, and unable to bring anyone back next month on its own.
The phone plays, circle prospecting, expired listings, and for-sale-by-owner work, produce listings in Wisconsin every week. They are also where consent exposure lives. Under the Telephone Consumer Protection Act, prospecting by phone or text makes an agent a telemarketer, and when the person on the receiving end later says they never agreed to the call, proving otherwise falls to the caller, number by number.
Predictive seller scoring helps order a call list. What a high score gives you is a guess attached to a name, and the agent still has to go build the relationship the score predicted.
Monthly home-value emails give an agent one good thread into an owner’s year. They also know nothing about what else that household is doing.
Generic all-in-one platforms put everything behind one login after months of configuration. Then the agent spends their week administering software instead of talking to clients.
Do-it-yourself content and newsletters are the right idea. They require a steady supply of material people actually want to open, produced while the agent is also running showings, negotiating, and managing a team. Almost nobody sustains that past the first quarter.
Paid ads switch on instantly and switch off just as fast. The flow stops the same week the spend does.
They share one limit. Every approach on that list reaches a Wisconsin household at the raised-hand moment, and raised hands run about 4% of the state’s owner base in a given year. Nothing on the list is present during the other 96%, which is precisely where the next three years of listings are sitting.
The metro Milwaukee numbers make the same point from the other direction. Listings across Milwaukee, Waukesha, Ozaukee, and Washington counties rose in 24 of the 32 months ending February 2026. Even so, the Greater Milwaukee Association of Realtors wrote in April 2026 that “the current market has no shortage of buyers and buyers are competing for too few listings.” The association added that the extra March listings “were absorbed almost immediately so there is no downward pressure on prices.” Buyers are there in numbers. What decides the outcome is whether a household already knows your name on the day the decision starts.
What an exclusive county partnership does that a stack of tools cannot
One agent, one team, or one brokerage takes a whole Wisconsin county under the Exclusive County Partnership. Their brand runs across the consumer experience there, and no other partner works inside that line. The fee is flat and predictable, with no charge attached to any single lead and no slice taken from the commission at closing, so a big month lands in the partner’s pocket rather than on their invoice.
The connection itself is built differently, which is why it converts. By the time someone asks to be introduced to a partner, they have usually been on ez Home Search for months. They show up carrying a record the agent can read: which streets they kept returning to, where their price kept settling, the valuation they pulled twice, the tour they eventually booked. That first call opens on what the person is actually after, so weeks of trust-building are already done before anyone speaks. Opportunities generally take 30 to 60 days to convert.
Underneath all of it sits the promise that makes people willing to engage at all. The Only Confidential Home Search is that promise. A person’s budget and the details for reaching them do not get sold, resold, recycled, or handed to a list of businesses they never picked. Instead the person gets one Single Local Expert who knows the area, picked as the right fit for what that person needs, not for outbidding anyone. ez Home Search calls that A Better Way To Discover Real Estate. Wisconsin households respond to it by saying what is actually going on in their lives instead of typing in a throwaway email address. Legacy real estate portals are built the other way around, and consumers have worked that out.
Four beats map straight onto how Wisconsin actually behaves.
Start with the database a partner already owns. With roughly 4% of Wisconsin’s owner base transacting in a given year, the biggest opportunity in the state is the past clients and sphere a partner earned years ago. ez Home Search brings that database onto the co-branded platform, keeps it warm with home-value updates, listing alerts, and local market reports the partner never has to write, and fires outreach on real activity rather than on a cold score. Partners reactivate past clients, by repeat business and by referral. Our own data puts the multiple somewhere no other channel reaches, 2.5 to 5 times the market rate, routinely higher than that. The database also stops leaking. Email addresses stop working at a rate of 15% to 22% every year, and one homeowner in ten changes their phone number. Because a partner’s people keep using the search, the current details keep coming back in.
Relocation runs in both directions. Census figures put annual moves past a typical service area on the order of one in twenty people. Wisconsin runs that hard both ways, with four straight years of net domestic in-migration, a Twin Cities commuter shed in St. Croix and Pierce counties, and a Chicago feeder market reaching Walworth County and the Northwoods. Because coverage is national, a past client who starts shopping another state does it on the partner’s own co-branded experience, and the partner sees that activity early. The local listing stays where it was earned, and a referral fee comes back from the far end of the move.
Every opportunity arrives with proof of consent. ezVerify.ai captures the opt-in, stores the recording behind it, runs the number against a known-litigator database, and strips out Do Not Call numbers before anyone dials. It fills in the rest of the contact detail too, and it reads where that person sits in their move, so a Milwaukee County browser and a ready-to-list Waukesha County seller get approached differently.
The conversion tools are already running. A partner can stand up a home-value page, an AVM widget, an instant cash offer, and a QR-code sign-in sheet for open houses, and each one works the moment it is made, since ez Home Search is what runs underneath. Nothing needs configuring and nothing needs administering.
All of it reports into whatever system a partner already runs, because ez Home Search is CRM and martech agnostic. Follow Up Boss gets the fullest version, with a contact’s searches and saved homes showing up in the agent’s dashboard and ezNurture running the automated follow-up. Sure Send™ goes deepest of all. Every other platform carries as much as its integration supports. None of this lands on the partner alone either: there are sales enablement playbooks, Shut Up and Dial events, and weekly coaching sessions, with real people working on the partner’s numbers alongside the technology.
One partner holds a Wisconsin county, and the open list keeps getting shorter
Wisconsin has 72 counties, and the Exclusive County Partnership places exactly one partner in each of them. Many are already claimed. More get taken every month, and after a county is spoken for, that co-branded position is off the market at any price.
The model does not care how large the county is. Milwaukee County closed 9,449 homes in 2025 and Menominee County closed 38, and the same thing decides the outcome in both. Buyers and sellers in a county start attaching one name to real estate there long before anybody picks up a phone. In a county the size of Florence, with 4,646 residents, that recognition is easier to build and worth every bit as much per transaction to whoever holds it.
Wisconsin’s fastest sales growth in 2025 did not happen in the metros. The North region grew 6.7%, led by counties like Sawyer at 18.6% and Polk at 16.5%, while the Southeast grew 0.2% on more than three times the volume. Counties that look small on a map are rarely small opportunities, and they tend to be exactly the ones an agent assumes will still be open next year.
A partner steps onto something that is already running. The search experience, the home valuations, the school and property-tax research, the listing alerts, the co-branding, and the automated follow-up all operate on a national platform, and the partner’s name goes on it. There is no build phase and no launch quarter. A Wisconsin county either has a partner or it does not, and that is worth finding out about yours before someone else does.
What building this yourself costs, against having it built for you
A Wisconsin agent who wants a bigger pipeline is choosing among three answers, whether or not they ever name them.
The default answer is to keep the current mix. Buy the shared leads, run the ads, work the phone, and stay one of more than 15,000 Wisconsin Realtors Association members competing for the same 4% of the state’s owner base that raises a hand in any given year. That produces business every year, and it never accumulates into a position.
The ambitious answer is to build the whole thing in house. That means a home search people come back to on their own, home valuations accurate enough that owners trust them, and school and property-tax research at the county and district level. It also means listing alerts fast enough to matter in a state that has held under four months of supply every year since 2022, co-branded content worth opening every month, consent proof and litigator screening before every dial, and follow-up that fires on real behavior rather than on a calendar. Each piece is buildable. Together they run into millions of dollars and years of engineering, and the data sourcing underneath them is beyond what any single team or brokerage in the state can buy. Most agents who start assemble a fraction of it, then spend their weeks keeping that fraction alive.
The third answer is to take the county position and put your name on a platform that is already running every piece of it.
The trade-off is worth stating plainly. County exclusivity does not fill a calendar next week. Opportunities generally take 30 to 60 days to convert, and the model rewards a partner willing to work an owner database over years rather than one who only wants the households raising a hand this month. An agent looking for a fast transactional lead buy is looking at the wrong thing.
One number carries more weight than the rest. Reactivation of past clients, by repeat business or referral, lands where our own data has always had it: 2.5 to 5 times the market rate. Neither of the other two answers compounds like that.
Go back to where this started. Milwaukee County permitted 199 single-family homes in 2025 and Dane County permitted 1,398. Those two counties will hand an agent completely different years, and neither of them will hand that year to somebody the household has never heard of. There is room for exactly one partner in each of Wisconsin’s 72 counties.
Find out whether yours still has room.
Frequently asked questions
New listings in Wisconsin fell in December 2025 while full-year sales rose. Where are agents finding sellers?
New listings dropped 5.9% in December 2025 while full-year sales rose 2.0% to 69,132. That combination means the sellers came off the existing owner base rather than out of a fresh listing wave.
Wisconsin holds well over a million owner-occupied households and turns roughly 4% of them in a year. Those sellers were already Wisconsin homeowners, and the agents who won them were the ones already in front of them with a home value, a property-tax answer, or a straight read on their local market.
Why does Milwaukee County build so few new homes compared with Dane County, and what does that mean for my business?
Milwaukee County permitted 199 single-family homes in 2025 against Dane County’s 1,398, and the pattern runs back a decade. The Milwaukee metro averaged 17.9 annual housing starts per 1,000 households from 2015 to 2025 while the Madison metro averaged 61.2. The divergence is decades old: Dane County and the city of Madison passed Milwaukee County and the city of Milwaukee in total equalized property value in 2018, after thirty years in which Dane’s value rose 526% against Milwaukee County’s 178%, per the Wisconsin Policy Forum in August 2018.
Practically, nearly every Milwaukee County transaction three years out is an existing home whose owner is living in it today, which makes your database the pipeline. In Dane and Waukesha counties, builder relationships and new-construction search behavior belong in the plan alongside it.
How do I work a Northwoods county where much of the demand comes from Chicago and the Twin Cities?
The demand is real and it is measurable. The North region posted Wisconsin’s fastest sales growth in 2025 at 6.7%, Vilas County’s median reached $425,500, and Oneida County’s sales rose 11.4%. National coverage matters more here than anywhere else in the state, because a Chicago household shopping Eagle River or Minocqua is searching from several hundred miles away, months before they call anyone.
On a co-branded ez Home Search experience, that household is searching on your platform and their activity surfaces to you. A shared lead works the opposite way: the same out-of-state name is sold to several agents at once, and none of them has a relationship with the person.
Wisconsin property tax bills jumped again. How do I turn that into listing appointments?
Start by being the person who explains the bill. Gross statewide levies were on pace to rise roughly 5% in 2026 after 4.4% the year before, the largest increase in 18 years, and K-12 levies alone rose 7.8%, the biggest jump since 1992.
Most owners assume the rate went up. Wisconsin’s average gross property tax rate actually fell from 2.3067% in 2000 to 1.5029% in 2024, and the value base underneath it more than tripled. A county exclusivity partner can hand an owner their own tax picture by county, city, and ZIP alongside a monthly home valuation. It gives you something worth saying in a year when nothing is listed, which is where listing appointments three years out actually come from.
My county’s median is under $260,000 and Waukesha County’s is near $490,000. Does one lead strategy work across Wisconsin?
No, and the spread is the reason. Wisconsin’s regional medians ran from $255,000 in the Central region to $380,000 in the South Central in 2025, and county medians stretched from roughly $195,000 in Clark County to $490,000 in Waukesha County. Inventory split the same way, with 2.6 months in metropolitan counties, 3.2 in micropolitan counties, and 3.9 in rural counties in December 2025.
What does travel across all of them is the sequence. Reach the household early, stay useful through the years when nothing is listed, and be the name they already trust when the move starts. County exclusivity is built around that sequence rather than around a price band.
Wisconsin lost about 9,500 manufacturing jobs in a year. Is that going to hurt my listing pipeline in the Fox Valley?
The composition matters more than the total. Wisconsin’s manufacturing workforce fell from 461,100 in January 2025 to 451,600 in January 2026, and industry leaders attribute most of the decline to retirements rather than layoffs. A retirement turns into a housing decision far more often than a layoff does, and it usually arrives with decades of equity behind it.
Health care employment reached a new high of 324,200 over the same period. Outagamie County closed 2,219 homes in 2025 and Winnebago County closed 1,996. Those homes are changing hands, and the Fox Valley pipeline holds.
Wisconsin has had four straight years of people moving in from other states. How do I get in front of them before they choose an agent?
Net domestic migration ran 5,828 in 2024 and 6,984 in 2025, a fourth consecutive positive year after two decades of losses. Those households research the Wisconsin market for months from wherever they live now, and none of them has met an agent yet.
To meet them that early, you have to be the local brand attached to the search experience they are already using, which is exactly what a county position buys. It runs in reverse too. When one of your past clients starts searching another state, that activity surfaces to you, so you keep the local listing and earn a referral instead of finding out once the move is done.
Data centers are going up in Racine, Dodge and Ozaukee counties. When does that turn into home sales?
Part of it already has. Microsoft completed its first Mount Pleasant facility in Racine County in May 2026 with roughly 550 full-time staff on site and about 800 expected once a second building runs, after a first build phase that employed nearly 10,000 construction workers across about two years. Meta broke ground in Beaver Dam in Dodge County in November 2025, and Vantage Data Centers is developing a campus at Port Washington in Ozaukee County.
Permanent staff put down roots in a way a temporary build crew does not, so the households worth tracking are the ones already living in those counties whose equity and plans are moving. Racine County closed 2,361 homes in 2025 and Ozaukee County closed 1,115 on a $479,000 median. An agent watching search and valuation activity across those counties sees the shift well before it becomes a listing.







Kurt Uhlir is a recognized leader in marketing, growth, and innovation, having helped scale companies and technologies used by millions every day—including at brands like eXp Realty, Sideqik, Vitrue, Oracle, Garmin, Facebook, Meta, Apple, and more. He’s trained tens of thousands of professionals on how to build trust, lead with service, and help clients make wise, informed decisions. At ez Home Search and Sure Send, his focus is on helping high-performing business owners, team leaders, and individual sales leaders grow their businesses through exclusive market access, privacy-first lead systems, and conversion-focused enablement tools.