

Rhode Island closed between 7,400 and 7,800 single-family homes in each of 2023, 2024, and 2025, according to year-end data from the Rhode Island Association of Realtors and State-Wide MLS. The state holds roughly 280,800 owner households, from Census Bureau counts of 441,570 households at a 63.6% owner-occupied rate. Under 3% of owners sold in any of those three years. Add condominiums and multifamily and the picture barely moves.
Almost nobody sold.
That gap is what most approaches to Rhode Island real estate leads get wrong. Nearly 6,000 Realtors in a state of 39 cities and towns compete for the small share of owners who have already raised a hand, bidding against each other for expireds, for shared portal names, and for the same neighborhoods. The owners who will move next are not in that fight. They are checking what their house is worth, watching one street, and telling nobody.
The agent who reaches them first is doing a different job than the one bidding for the hands already in the air.
The Rhode Island seller you want is out shopping for a house right now
Roughly four in five Rhode Island buyers already own a home they will have to sell, so the listing an agent takes next year usually belongs to somebody touring houses today. Most agents never work that person until the second half of the move.
Look at how the two campaigns are usually run. “List with me” goes out to sellers, bought buyer leads get handed to someone junior, and the same household ends up chased twice by the same office under two different pretexts.
Here is where that ratio comes from. The National Association of Realtors, in its 2025 Profile of Home Buyers and Sellers, puts first-time buyers at 21% of purchases, the smallest share the association has recorded since it started tracking in 1981. The median first-time buyer is now 40 years old, a record, and the median seller is 64, also a record. Everyone outside that 21% owns something they have to unload first.
Be precise about the claim, because the loose version of it is wrong. Any single house has one person buying it and a different person selling it. Across a move, though, both halves belong to the same household, and that household almost always starts on the buy side long before a listing agreement exists. Somebody spends the better part of a year looking at what their money buys in Barrington or East Greenwich, then calls an agent about the house they already own.
Rhode Island’s own numbers show the entry side plainly. RIHousing financed 1,465 first-time buyers in 2025 at an average age of 38, according to its 2025 Impact Report, though that is a program count and not a market share. Those buyers are the one in five. The other four in five are sitting on equity in a house nobody has listed yet.
ez Home Search reads behavior instead of picking a lane. A valuation run twice, a home-value page opened, a question about equity, and the seller conversation is live. A saved search, an alert opened within the hour, a tour on the calendar, and the buyer side is moving. Most Rhode Islanders produce both patterns in sequence, and the platform follows the shift rather than guessing which campaign a person belongs in. The automated valuation model, an estimate of what a home is worth built from public records and market data, keeps the partner present through the years in between, so the buyer an agent helps in one decade is the listing they take in the next.
Rhode Island has roughly 280,800 owner households. Nearly every one of them is a future seller, and most of them will start out shopping.
One partner holds each Rhode Island county, and the state only has five. Find out whether yours is still available.
What is actually happening across the Rhode Island market
Rhode Island is a fast, competitive, expensive market where homes trade hands less often than they used to. Both halves of that sentence matter, and most market summaries only carry the first.
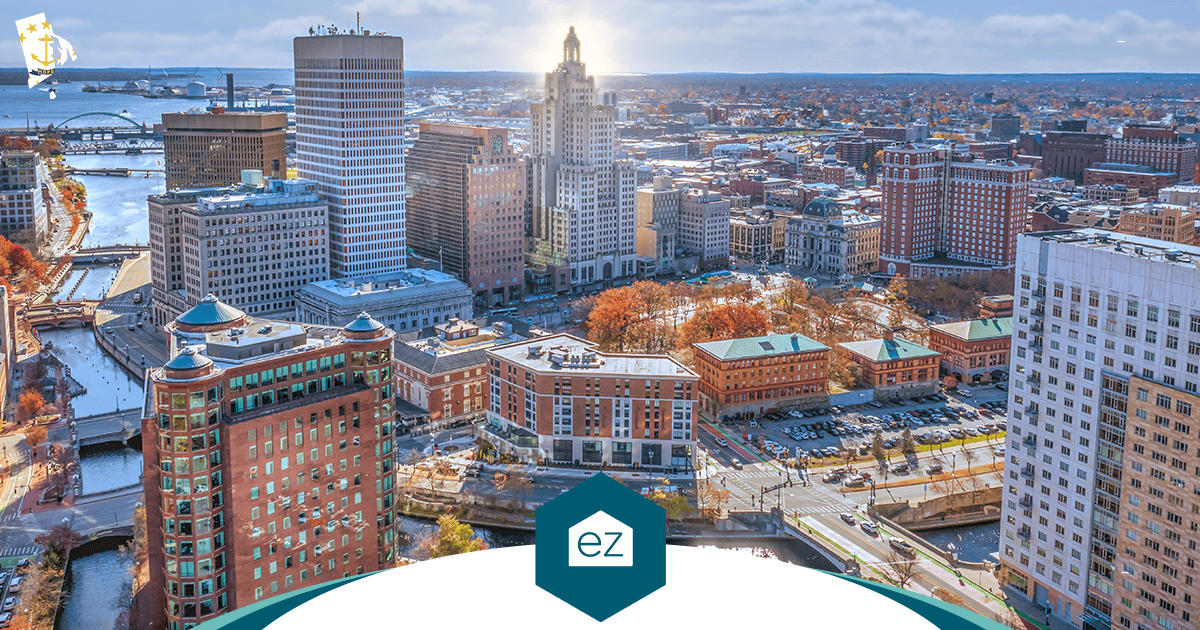
Start with price and speed. The statewide median single-family price climbed in each of the last three years on record, from $425,000 in 2023 to $474,700 in 2024 to $499,900 in 2025, per year-end data from the Rhode Island Association of Realtors and State-Wide MLS. Houses move fast here and have for years. Average days on market has sat between 31 and 33 every year since 2022, down from 61 in 2019. Supply is the binding constraint behind both numbers. Rhode Island has run under a two-month supply of single-family homes and condominiums across 2024 and 2025, against 3.3 months nationally per NAR figures the association cited, and five to six months is what the association names as balanced. Its president calls the shortage a problem that predates the pandemic, since made worse by owners holding older mortgage rates.
Condominiums are where affordability went. Condo sales grew 5.8% in 2025, the largest gain of any housing type that year, on a $390,000 median. Set that against a single-family median that rose from $425,000 to $499,900 across the same three years and the condo becomes the entry point a local buyer can still reach. Multifamily ran the other way on price, with the median up 8.2% while sales stayed essentially flat at half a percent of growth. An agent working Pawtucket or Woonsocket is working a fundamentally different product mix than one working Jamestown.
Buyers are arriving from outside the state in numbers worth planning around. Out-of-state buyers accounted for 22.5% of all Rhode Island residential sales in the most recent year the association reported, and 41.1% of sales at $1 million or more. More than 12% of all sales came from Massachusetts alone, where single-family prices sit well above Rhode Island’s $499,900 median. A Rhode Island house at half a million dollars reads as a discount from Attleboro or Fall River, and that math is not going away. Institutional buyers moved harder here than nationally as well: NAR research reported by the state association puts Rhode Island’s institutional share at 22.5% of sales in 2024, up from 10.9% in 2019, while the national share barely moved from 15.1% to 15.7%.
Migration deserves its actual size rather than its usual headline. In the most recent year Census Bureau estimates cover, Rhode Island lost 1,551 residents to other states, gained 5,923 from abroad, recorded 304 more deaths than births, and finished up 4,106 people at 1,114,521. The longer series carries the same message. The state’s population has risen in every year since 2021, from 1,097,381 to 1,114,521. Against 441,570 households, net domestic outflow is a fraction of one percent. It also cuts both ways for an agent: people leaving are listings and referral fees, people arriving are buyers.
Construction picked up from a low base. Rhode Island municipalities issued 3,778 building permits in 2025, the highest count since the 1980s, and 2,162 certificates of occupancy across all 39 cities and towns, according to the Executive Office of Housing’s 2025 Integrated Housing Report. The governor’s office characterizes the gain as consistent progress year after year rather than one strong season. Providence alone opened 727 new units and West Warwick 183.
Employment is spread across sectors rather than resting on one anchor, and the two clearest growth stories both run over years rather than quarters. Defense manufacturing leads. Quonset Point in North Kingstown supports 15,309 direct on-site jobs across more than 250 companies, plus another 14,146 indirect and induced, which together account for 5.8% of all Rhode Island jobs. That comes from an independent Bryant University study published by the Quonset Development Corporation, which also puts the total employment impact up 32% since 2018 and Quonset’s 9,881 manufacturing positions at 25% of the state’s manufacturing workforce, against 20% in 2023. General Dynamics Electric Boat is adding roughly 3,000 to 3,500 more jobs there, on top of the more than 8,000 it already employs, per the office of US Senator Jack Reed.
Life sciences is the second story. Providence’s 195 District has drawn 17 completed or planned projects and more than $890 million across 26 acres. Behind it sit a state Life Science Hub funded at $45 million in 2023 and Ocean State Labs, the state’s first commercial incubator, which opened in 2026. Those are paychecks landing in a county that closes over 1,200 single-family sales a year and a capital city that opened 727 new units in 2025.
The other half rarely makes the summary. Statewide closed single-family sales ran 11,066 in 2016, 11,282 in 2017, 10,687 in 2018, 11,013 in 2019, 11,650 in 2020, and 11,500 in 2021, then 9,565, 7,409, 7,708, and 7,811 in the four years that followed. The ten-year average is 9,969. Over that same decade the median price rose 108%, days on market fell from 61 to 33, and distressed sales fell from 869 to 63. Demand held. What changed is how often the same houses come up for sale. Rhode Islanders are staying put longer, which pushes the transaction an agent wants further out in time.
Table 1: Rhode Island’s five counties
| County | Population (Jul 2025) | Principal cities and towns | 2025 single-family sales | 2025 median price |
|---|---|---|---|---|
| Providence | 678,179 | Providence, Cranston, Pawtucket, Woonsocket, East Providence, Cumberland, North Providence, Johnston | 3,726 | $450,000 |
| Kent | 173,495 | Warwick, West Warwick, Coventry, East Greenwich, West Greenwich | 1,780 | $443,000 |
| Washington | 129,795 | South Kingstown, North Kingstown, Westerly, Narragansett, Charlestown, New Shoreham | 1,222 | $675,000 |
| Newport | 83,051 | Newport, Portsmouth, Middletown, Tiverton, Jamestown, Little Compton | 676 | $789,500 |
| Bristol | 50,001 | Bristol, Barrington, Warren | 407 | $685,000 |
Population: US Census Bureau estimates via the Rhode Island Department of Labor and Training, March 2026. Sales and median price: Rhode Island Association of Realtors and State-Wide MLS, year-end 2025, the most recent full year in a series that has held statewide volume between 7,400 and 7,800 sales since 2023 while the statewide median rose in each of those years.
How Rhode Island’s five counties and seven regions diverge
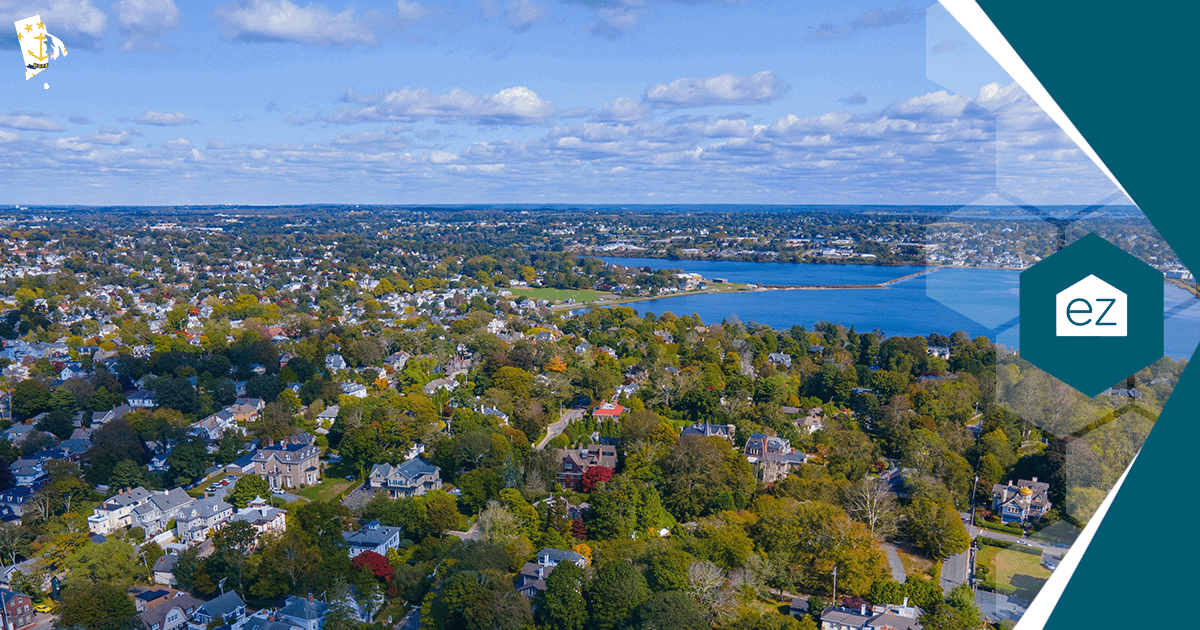
Rhode Island’s growth has concentrated in one county while its highest prices sit in another that is getting smaller. Providence County went from 660,723 residents at the 2020 census base to 678,179 by July 2025, per Census Bureau estimates published by the state Department of Labor and Training. The state as a whole grew by about the same number of people. Providence County absorbed essentially all of it.
Newport County moved the other way, down 3.0% to 83,051. It also carries the highest county median in the state at $789,500 and the longest average marketing time at 50 days. Both facts are true at once, and neither is a verdict on whether the market is healthy. Fewer people live in Newport County than did five years ago, and the houses there cost more than anywhere else in Rhode Island. That is a supply story and a desirability story sitting on top of each other.
Kent County is the volume engine. It closes roughly 1,780 single-family sales a year, and Warwick alone accounts for 961 of them, more than any other municipality in the state. An agent who wants transaction count works Kent. An agent who wants transaction size works Newport or Bristol, where Bristol County‘s median reached $685,000, second highest of the five counties, carried by Barrington at a $750,000 median.
Washington County is the one that rewards patience. It holds the newest housing stock in the state, the Quonset employment base in North Kingstown, and the widest internal price range in Rhode Island, from Hopkinton at $500,000 to Block Island at $1,870,000 on 19 sales.
Table 2: Rhode Island regions
| Region | Towns | Sourced trend |
|---|---|---|
| Providence metro | Providence, Cranston, East Providence, Johnston, North Providence | Providence opened 727 new units for occupancy in 2025, the most of any Rhode Island municipality, inside a statewide permit count that reached its highest level since the 1980s (RI Executive Office of Housing, 2026) |
| Blackstone Valley | Pawtucket, Central Falls, Woonsocket, Cumberland, Lincoln, Smithfield, North Smithfield | Carries the state’s lowest entry prices, with Pawtucket and Woonsocket medians near $390,000 to $400,000, while statewide residential property values rose 47% between FY2023 and FY2026 (RIAR, 2026; RIPEC, 2026) |
| Northwest Rhode Island | Burrillville, Glocester, Foster, Scituate | Statewide accessory dwelling unit permits rose from 11 in 2021 to 163 in 2024, and these are the low-density towns where the added space is most usable (HousingWorks RI, 2025) |
| East Bay | Barrington, Bristol, Warren | Bristol County’s median reached $685,000, second highest of the five counties, while its population slipped from 50,789 in 2020 to 50,001 in 2025 (RIAR, 2026; Census via RI DLT, 2026) |
| Aquidneck Island and Sakonnet | Newport, Middletown, Portsmouth, Jamestown, Tiverton, Little Compton | Newport County’s population fell 3.0% between 2020 and 2025 while its median reached $789,500, the highest of the five counties (Census via RI DLT, 2026; RIAR, 2026) |
| South County | South Kingstown, North Kingstown, Narragansett, Westerly, Charlestown, Exeter, Hopkinton, Richmond, New Shoreham | Charlestown, Exeter, Richmond, South Kingstown, and West Greenwich are the only Rhode Island municipalities whose housing averages a build year of 1978 or later (RI Executive Office of Housing, 2026) |
The seventh region, West Bay, covers Kent County’s Warwick, West Warwick, Coventry, East Greenwich, and West Greenwich, and it behaves less like a region than like the state’s clearing house: mid-priced, high-volume, and the place where buyers priced out of Barrington and Wickford end up instead.
Seven regions in a state you can drive across in 45 minutes, each running on different math. That is the argument against treating Rhode Island as one market, and it is the argument for holding a county rather than farming a few streets inside one.
The Rhode Island towns most agents drive past
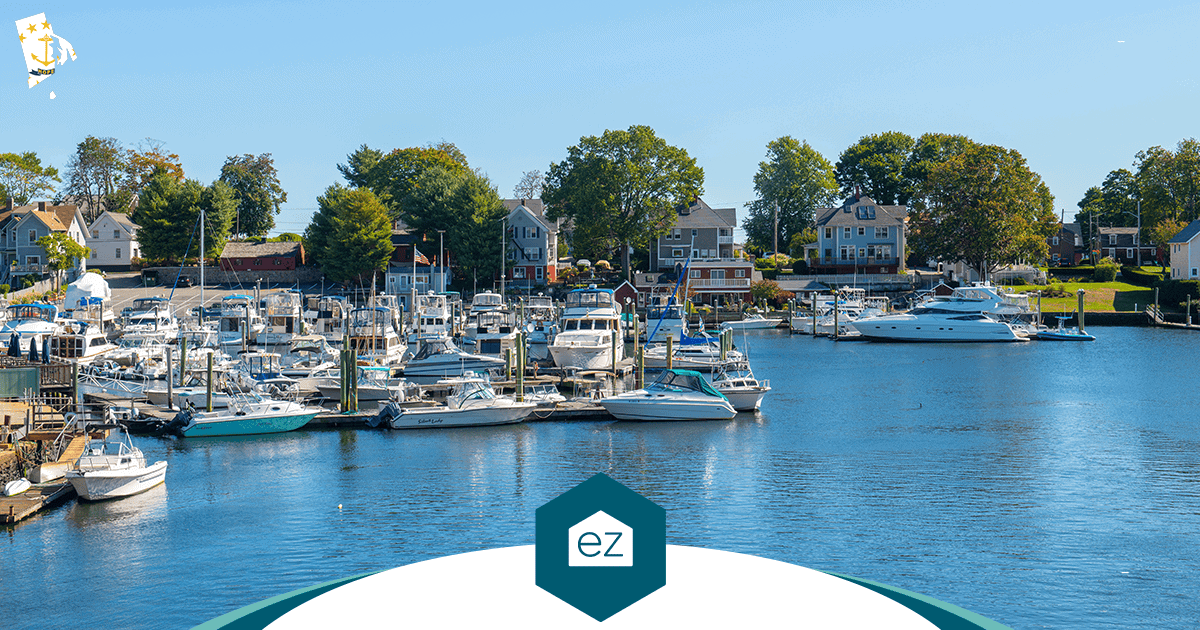
The newest housing stock in Rhode Island sits in small South County towns, while the most new units go up in the urban core, and those are two different facts that send an agent in two different directions.
Take the stock first. Rhode Island’s housing has a median construction year of 1964, third-oldest in the country behind only New York and Washington DC, according to the Executive Office of Housing’s 2025 Integrated Housing Report. Providence’s median is 1939. Only five municipalities in the entire state have housing that averages a build year of 1978 or later: Charlestown, Exeter, Richmond, South Kingstown, and West Greenwich. Four of the five sit in Washington County. That is a statement about the typical house already standing in those towns, not about how much gets built there.
New construction runs the opposite way. Providence opened 727 new units for occupancy in 2025 and West Warwick 183, the two highest counts in the state, per the same report. A city can lead the state in new units and still carry the oldest median in it, because 727 new units barely move a housing stock built mostly before the war.
For an agent, both halves are a working condition rather than a piece of trivia. Pre-1978 housing means lead paint disclosure on nearly every transaction in the state, buyers who need renovation financing more often than buyers in newer markets do, and inspection findings that unsettle first-time buyers expecting a house built in this century. A buyer who wants a newer existing home is shopping South County. A buyer who wants something nobody has lived in is shopping Providence or West Warwick. Knowing which conversation to have saves everyone a month.
The volume is smaller out there. Exeter closes about 61 single-family sales a year, Foster about 51, West Greenwich 46, Little Compton 31, and New Shoreham 19. A team that needs 200 transactions a year cannot live on those towns. A partner who holds Washington County gets all nine of its towns at once, Block Island and Exeter alongside South Kingstown‘s 243 sales and North Kingstown’s 235, which is a different proposition entirely.
Table 3: Rhode Island municipalities beyond the Providence metro
| Town (county) | 2025 single-family sales | 2025 median | Villages and neighborhoods |
|---|---|---|---|
| Coventry (Kent) | 448 | $438,950 | Anthony, Washington, Greene, Quidnick |
| South Kingstown (Washington) | 243 | $694,500 | Wakefield, Peace Dale, Kingston, Matunuck |
| North Kingstown (Washington) | 235 | $650,000 | Wickford, Davisville, Saunderstown, Hamilton |
| Westerly (Washington) | 209 | $610,000 | Watch Hill, Misquamicut, Weekapaug, Bradford |
| Narragansett (Washington) | 178 | $932,500 | Point Judith, Galilee, Bonnet Shores, Narragansett Pier |
| Portsmouth (Newport) | 169 | $745,000 | Common Fence Point, Island Park, Prudence Island |
| Tiverton (Newport) | 160 | $499,500 | Tiverton Four Corners, Nanaquaket, Stone Bridge |
| Burrillville (Providence) | 127 | $475,000 | Harrisville, Pascoag, Oakland, Mapleville |
| Charlestown (Washington) | 113 | $715,000 | Quonochontaug, Cross Mills, Kenyon |
| Glocester (Providence) | 99 | $519,900 | Chepachet, Harmony, West Glocester |
| Hopkinton (Washington) | 94 | $500,000 | Ashaway, Hope Valley, Rockville, Canonchet |
| Scituate (Providence) | 88 | $518,050 | North Scituate, Hope, Rockland |
| Richmond (Washington) | 70 | $545,000 | Wyoming, Arcadia, Wood River Junction |
| Exeter (Washington) | 61 | $650,000 | Fisherville, Liberty |
| Foster (Providence) | 51 | $500,000 | Foster Center, Moosup Valley |
| West Greenwich (Kent) | 46 | $591,000 | Nooseneck, Escoheag |
| Little Compton (Newport) | 31 | $985,000 | Adamsville, Sakonnet Point |
| New Shoreham, Block Island (Washington) | 19 | $1,870,000 | Old Harbor, New Harbor, Corn Neck |
Rhode Island Association of Realtors and State-Wide MLS, year-end 2025, the most recent full year available. Statewide single-family volume has run between 7,400 and 7,800 in every year since 2023, so these town-level counts are representative rather than a one-year spike.
Look at what the small numbers are attached to. Foster‘s 51 sales carried a $500,000 median and Exeter’s 61 came in at $650,000, both above the $450,000 median across Providence County’s 3,726 sales. Call these markets thin rather than leftover. A thin market rewards the agent whose name is already on the search a buyer has been running for two years, because there are fewer chances and each one counts for more.
Remote and hybrid work is still a Rhode Island buying signal
Remote work did not go away, and the agents who believed the headlines have been mispricing a lasting source of Rhode Island demand for years. The confusion comes from a measurement choice. Coverage of the subject compares today against the emergency peak of spring 2020, when roughly 61% of paid workdays happened at home. Nobody ever treated that as a steady state. Measured against the pre-pandemic baseline of about 5% to 8% of paid workdays, the level today represents a structural tripling that has held since 2023.
Two federal numbers are worth carrying into client conversations. The Census Bureau put its Business Trends and Outlook Survey to roughly 150,000 US firms, and 31.2% of them had at least one employee putting in a full workday from home, a level those same employers expect to hold five years out. The worker-side count runs the same way: 36.7 million Americans teleworking in the fourth quarter of 2024 by the Bureau of Labor Statistics tally, against 32.5 million twelve months before. Both figures are national, and neither one gets to be restated as a Rhode Island statistic.

What is specifically Rhode Island is the geography positioned to absorb it. Washington County towns like Exeter, Richmond, Hopkinton, and Charlestown, the northwest quadrant of Providence County across Burrillville, Glocester, Foster, and Scituate, plus West Greenwich, Coventry, Tiverton, and Little Compton, are exactly the markets that were priced by commute distance and are now priced by something else. Rhode Island’s mean travel time to work is 25.5 minutes and 91.7% of households hold a broadband subscription, per Census figures. In a state this compact, a two-day-a-week office schedule erases the penalty that used to make Hopkinton a compromise.
The practical version is the part an agent can use on a showing. Remote and hybrid buyers want a work space with a door they can shut, an accessory dwelling unit, a separate structure on the lot, more square footage than their household size suggests, and internet that holds a video call. Rhode Island just made one of those far easier to deliver. Statewide accessory dwelling unit permits went from 11 in 2021 to 163 in 2024, per the HousingWorks RI 2025 Housing Fact Book, after the state loosened the rules.
Most Rhode Island agents still sell these towns on price. The buyers moving there are shopping for a floor plan that supports a job nobody drives to.
Three Rhode Island tax changes landed inside twelve months
Rhode Island changed the tax treatment of selling a home, renting one short term, and owning a second one, all between October 2025 and July 2026. Clients are asking about all three, and an agent who cannot answer plainly loses authority in precisely the conversations that produce listings.
The conveyance tax went up. The residential conveyance tax, which is the tax paid on the transfer of a property at closing, rose from $2.30 per $500 of the price to $3.75 per $500 as of October 1, 2025. On top of that, any portion of a sale price above $800,000 carries an additional $3.75 per $500. The Rhode Island Association of Realtors opposed the increase and published the Division of Taxation’s worked examples for members. For a seller in Barrington or Narragansett, this is now a line item large enough to affect a net-proceeds conversation.
Short-term rentals got taxed. Whole homes and whole condominiums rented for fewer than 30 days took a 5% state whole-home tax on January 1, 2026, and the local hotel tax doubled from 1% to 2%. Any Westerly, Narragansett, Block Island, or Newport client running a summer rental is doing new arithmetic on whether the property still works.
Second homes over $1 million now carry an annual state tax. Non-owner-occupied properties assessed at $1 million or more, and occupied by neither the owner nor a tenant for at least 183 days in the year, are taxed $2.50 per $500 of assessed value above $1 million starting July 1, 2026. A property assessed at $1.5 million owes roughly $2,500 a year.

That last one is the one to build outreach around, because it comes with a count. The Rhode Island Public Expenditure Council estimates the tax will reach 9,000 to 10,000 properties and raise about $25.0 million annually. Those are 9,000 to 10,000 identifiable Rhode Island owners receiving a new recurring bill, concentrated in the coastal and island markets that carry the state’s highest medians. Some will absorb it. Some will convert to a rental. Some will decide the math stopped working, and those conversations happen with whoever is already in front of them.
The wider picture supports the same point. RIPEC ranks Rhode Island 10th highest in the nation for property taxes per capita, 22% above the US per capita total in FY2023, and reports that seven municipalities exceeded the state’s 4.0% levy cap in FY2026, the most in a decade, while the statewide levy grew $98.3 million. Property taxes are a live topic at almost every kitchen table in this state.
An ez Home Search partner can pull property tax comparisons by state, county, city, and ZIP inside the platform, so a question about what Little Compton costs to hold against Tiverton gets answered in the conversation rather than in a follow-up email three days later.
How Rhode Island agents try to win listings today, and where each approach runs out
Every lead-generation method Rhode Island agents use works to some degree, and every one of them hits the same wall: they all fish in the small pool of people who have already decided to move.
Shared leads from legacy real estate portals do produce contacts, and a disciplined agent with a fast dialer converts some of them. The structural problem is that the same name goes to several agents at once, the person did not choose any of them, and the contact arrives cold at the moment it arrives. An agent who buys more of them raises the bill without changing the odds.
An IDX website is a real asset that an agent owns outright. It is also slow. It takes months to rank, it needs content added constantly to stay ranked, and the great majority of the traffic it earns never identifies itself. An agent who builds and runs one has taken on a marketing job on top of a real estate job.
Cold calling expireds and for-sale-by-owner listings still works, and plenty of Rhode Island’s top producers were built on it. In a one-MLS state, the catch is that everyone else is looking at the same expired list the same morning. That is also where the compliance exposure lives, which the next section covers.
Predictive-seller software scores a database and tells an agent who might list. The score is a guess about a person the agent still has to build a relationship with. A name flagged as likely to sell is not a warm introduction, and the software does not make the introduction.
Generic all-in-one platforms and do-it-yourself content both trade money for time and then take the time anyway. Paid ads spike with the spend and go quiet the week it stops. Geographic farming is the traditional differentiator, and in Rhode Island it barely differentiates: 1,061 people per square mile across 1,033.89 square miles means a competitor’s farm is a fifteen-minute drive away, and farm boundaries overlap everywhere.
Then there is the arithmetic underneath all of it. The Rhode Island Association of Realtors reports nearly 6,000 members across nearly 1,000 offices. The state has closed between 7,400 and 7,800 single-family sales in each of the last three years on record. Out-of-state buyers took 22.5% of all residential sales in the most recent of those years, and NAR research reported by the association puts the institutional share of 2024 sales at 22.5%, up from 10.9% in 2019. A local first-time buyer is bidding against both, and the agent representing that buyer absorbs every lost offer as unpaid work.
The mechanism ez Home Search runs is different in kind. Instead of competing for people at the active stage, it reaches them through the three stages that come first: dreaming, then gathering numbers on their own home’s value and on what other homes cost, then planning around financing, timing, and the school calendar. Those stages are long and they are private, which is why they stay invisible to anything that only counts hand-raisers. The platform then reads real activity to say which side is live right now. Someone runs a valuation a second time. Someone revisits a home they saved months ago. Someone picks an old search back up after eight months away. That signal routes to one partner in the county rather than to whoever paid most for the name.
Set expectations honestly, because a Rhode Island agent has heard oversized promises before. Partners typically convert these connections over 30 to 60 days, not inside a week, and the relationships that start this way tend to run for years. The trade is patience at the front for a pipeline that compounds instead of resetting every campaign.
If you want the mechanics rather than the sales pitch, see how the county partnership works.
What an Exclusive County Partnership does for a Rhode Island agent or team
One whole Rhode Island county goes to a single agent, team, or brokerage under an Exclusive County Partnership, co-branded through the consumer experience, with no rival partner allowed inside those lines. The commercial terms are worth stating up front because they are unusual: one predictable fee, nothing charged per lead, and no cut of the commission on a closing. A strong month is a strong month, not a bigger invoice.
The reason those connections convert has less to do with volume than with how the person arrives. People come to ez Home Search because nobody sells, resells, recycles, or broadcasts their contact details and their budget to businesses they did not choose. Each person is matched with a Single Local Expert who knows their area, chosen as the right fit rather than as the highest bidder. The Only Confidential Home Search is the name ez Home Search gives that promise, and it is the shape A Better Way To Discover Real Estate takes for a person who is still only looking. A partner meeting someone through that experience opens with a person who already trusts the platform and whose intent is on the record as behavior, which is a very different first conversation than a call to a purchased name.
Confidentiality carries particular weight in a state this size. Rhode Island has 1.1 million residents, one statewide MLS, and 88.9% of people living in the same house they lived in a year earlier, per Census figures. A couple in Cumberland thinking about a move knows their agent’s kids go to school with theirs. One spouse often explores a move for months before raising it with the other. Someone heading toward a divorce may spend six to twelve months planning before a word of it reaches anyone else. People research the biggest financial decision of their lives in private, and they will not run that research through a platform that answers one search with a week of phone calls.
The scale of that invisible population shows up in an unexpected place. RIHousing reported that more than 3,400 Rhode Islanders completed a homebuyer education class in 2025, in a state that closes between 7,400 and 7,800 single-family homes a year. Those are self-identified future buyers, most of them months or years from a transaction, and almost none of them sit in any agent’s pipeline today.
What a partner receives is already built and already running, because it is ez Home Search’s own national platform wearing their brand. A partner gets the search itself, listing alerts, home-value updates, market reports, the automated valuation model widget for their own site, an open-house page behind a QR code, and an instant cash offer for the owner who wants to know what a fast sale would bring. Nothing needs configuring and nothing needs administering. It all runs on one record of activity, so a visitor any of those tools captures becomes a tracked contact the platform keeps drawing back.
National coverage matters more in Rhode Island than the state’s size suggests. Census figures put annual relocation at roughly 2.1% of Americans changing states and about another 3% crossing into a different county inside their own state, and in a state 45 minutes across, a move to Massachusetts or Connecticut is a routine commute decision. When a past client starts searching Fall River or Mystic, they do it on the partner’s co-branded platform rather than leaving for a legacy portal, and that search shows up as a signal. The agent reaches out before the listing is in play, works the sale of the Rhode Island house, and hands the purchase off to a vetted agent on the other end, earning a referral fee. That silent loss is the one our long-time county partners say they never used to see coming.
The Rhode Island database you already own is the biggest opportunity you have
In a state where under 3% of owners have transacted in any of the last three years on record, the past clients and sphere an agent has already earned are the highest-probability pipeline available to them, and they are almost always the least worked.
The gap between how people feel about their agent and what they actually do is wide. Research reports put the share of buyers who say they would use their agent again or recommend them at between 88% and 92%. About 18% end up buying through an agent they already worked with once. That difference is repeat and referral business an agent earned and then let go. Across all agents, repeat clients and referrals account for roughly 41% of business, and for the most experienced agents it is the majority of what they do.
Meanwhile the list itself decays without anyone touching it. Somewhere between 15% and 22% of email addresses stop working in a given year, and as many as one household in ten changes its phone number. A Rhode Island database that looked complete three years ago is partly unreachable today, and the contacts who slip away first tend to be the ones who moved, which is to say the ones who were transacting.
Most agents know the database matters. The follow-up is where it falls apart, because doing it properly takes a steady stream of content people open and a search experience past clients come back to without being asked. Almost nobody can produce that while also serving clients and running a team.
An Exclusive County Partner does not produce it. Because their past clients keep using the co-branded search, the home value updates, and the listing alerts, ez Home Search captures their current email and phone as those details change, so the list stays reachable without a scrub. Outreach then fires on real activity from people who already know the agent by name rather than on a cold score for someone showing no sign of moving, and it runs inside whatever CRM the partner already uses, with ezNurture handling the automated follow-up in Follow Up Boss. The first-party result is specific: partners win past clients back, by repeat business or by referral, 2.5 to 5 times the market rate, sometimes better.
Other tools each solve one piece of this honestly. Predictive scoring identifies who might list. A monthly automated value estimate gives a client one reason to open an email. A done-for-you content service fills an inbox. None of them is a place a past client goes back to on their own, month after month, which is what keeps a relationship warm across the years Rhode Islanders now stay in their houses.
Proof of consent on every Rhode Island opportunity
The Telephone Consumer Protection Act counts a real estate agent as a telemarketer from the first prospecting call or text, and most agents working expireds in this state have never been told that. The part that catches people is where the burden falls. A recipient who disputes consent owes no proof that they never agreed. Proof runs the other way, and the agent who dialed has to produce it, number by number.
The arithmetic gets serious quickly. Every undocumented call or text is worth $500 on its own, $1,500 where the violation was willful, with no ceiling on what the total can reach. Take a 10-agent team that runs 3,000 calls through a dialer in a single campaign. If it cannot document consent for 2,000 of them, exposure starts near $1 million and reaches $3 million, before anyone counts a second campaign. These suits are usually filed as class actions, and discovery requires the team to hand over its call logs and contact database, at which point every unaccounted number can be added to the case.
Rhode Island makes this sharper than most states for a plain reason. One statewide MLS means every expired listing appears to every agent at the same moment, so the same homeowner fields calls from several agents the same morning. Call volume goes up, and documentation rarely keeps pace with it.
Opportunities reach an ez Home Search partner with that problem already handled. ezVerify.ai captures the opt-in and holds a recording of it, puts the number through a known-litigator database check before the first dial, screens out any number on the Do Not Call registry, then closes gaps in the contact record that would otherwise cost an afternoon of digging. A dispute over consent then meets documentation instead of an argument.
It also changes how the call feels. The riskiest part of the job is the outreach, and here the person on the other end is real, opted in, and expecting to hear from someone. An agent can make that call from a footing the rest of their prospecting list never provides.
Five counties, five partners
Rhode Island has five counties, which means the Exclusive County Partnership map for the entire state is five positions: Providence, Kent, Washington, Newport, and Bristol. There is no sixth, and there is no way to make one.
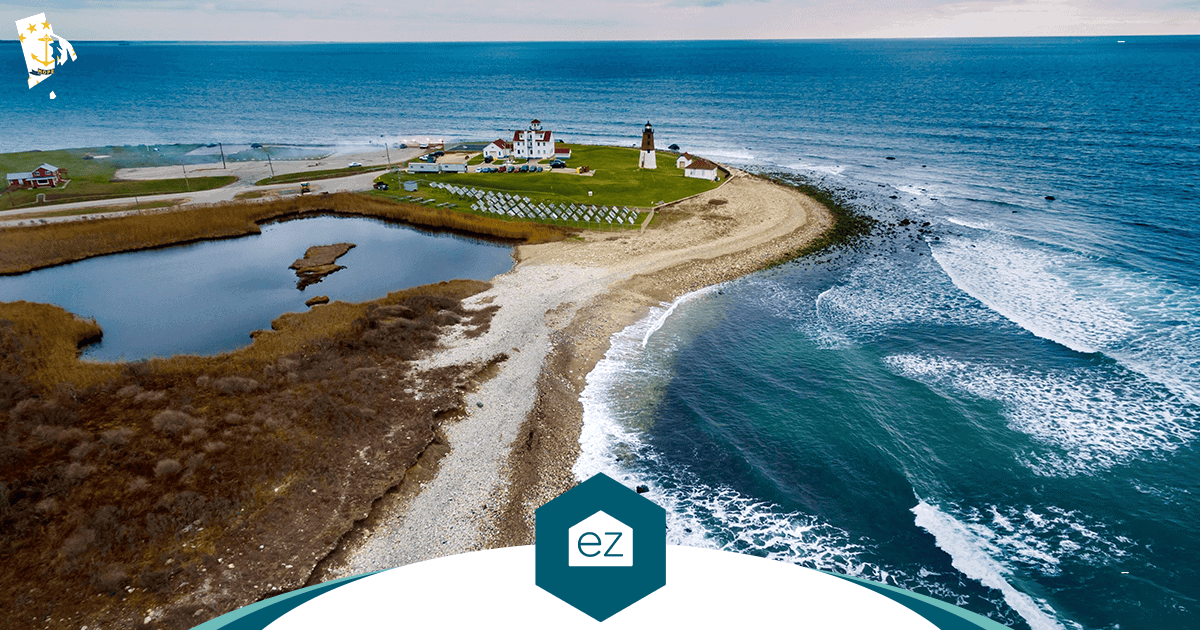
Look at what each position holds, on the most recent full year of record. Providence County carries 678,179 of the state’s 1,114,521 residents and produces 3,726 single-family sales. Kent County produces 1,780, with Warwick’s 961 inside it. Washington County produces 1,222 across nine towns from Westerly to Block Island. Newport County produces 676 on the highest median in the state. Bristol County produces 407 on the second highest. In most states a county is a slice of a market. In Rhode Island a county is a third of one.
Recognition is what makes that position worth holding, and the research on how people choose an agent is blunt about it. In the NAR Profile of Home Buyers and Sellers, 81% of sellers reach out to a single agent and choose from that one conversation, and 77% of repeat buyers interview only one. Reputation is the factor sellers weigh most heavily in the same research, the top reason for 35% of them. For most Rhode Islanders there is no comparison shopping at all. One name is already attached to real estate where they live, and it gets the call.
An agent who builds that kind of county-wide recognition alone spends years at it and more money than a single team can afford, because even a strong local brand cannot reach a whole county by itself. A partner’s name sitting on the home search that county already uses accelerates something they have been working on for a decade.
Counties are held by one partner at a time, and more of them get claimed every month. Whether a particular Rhode Island county is open right now is a question with an answer, and asking is the only way to get it.
Deciding whether an Exclusive County Partnership fits your Rhode Island business
Three paths are open to a Rhode Island agent who wants more listings, and they are worth laying side by side honestly.
The first is to keep working the declared flow. Buy shared leads, call the expireds, farm a few streets, and compete with nearly 6,000 other Rhode Island Realtors for the under 3% of owners who transact in a given year. Plenty of good agents make a living this way. The cost is that every year starts at zero and the pool never gets bigger.
The second is to hold one of Rhode Island’s five counties. Reach people through the private stages of a move, let their own activity tell you which side is live, and own the recognition inside a territory no competing partner can enter.
The third path is building the whole thing in-house. Assemble the data, the valuations, the alerts, the search experience, the follow-up automation, and the consent documentation. That is a technology and marketing stack costing millions to build and run, and the data sourcing by itself is beyond what any single Rhode Island team or brokerage can reach.
One honest trade-off belongs in the decision. This is not a next-week pipeline. Partners typically convert these connections over 30 to 60 days, and the parts that compound, the reactivated database, the county-wide recognition, the relocation listings that stop leaking to strangers, build across the years a partner holds the territory rather than inside the first quarter. An agent who needs a closing in three weeks should go call expireds. An agent building a business that still produces in 2032 is looking at a different instrument.
The proof point worth carrying out of this article is one number. Past clients come back to an ez Home Search partner, buying again or sending a referral, 2.5 to 5 times the market rate. Across a state where more than 97 of every 100 owners stay put in any given year, that multiple applies to the largest and cheapest pool of business any Rhode Island agent already owns.
Those 97 are not a dead market. They are the pipeline, and the agent whose name is already on the search they have been running without telling anyone is the one who gets the call when they finally move.
Rhode Island counties get claimed one at a time, and there are only five to claim. Check whether your county is open.
Frequently asked questions
Rhode Island has only five counties. How much territory does one Exclusive County Partnership actually cover?
More than in almost any other state, which is the point. Providence County alone holds 678,179 of Rhode Island’s 1,114,521 residents and produces about 3,726 single-family sales a year. Kent County covers Warwick, West Warwick, Coventry, and both Greenwiches, and produces about 1,780 of them. Washington County stretches across nine towns from Westerly to Block Island.
A county partnership in a large state gives an agent one piece of a metro. In Rhode Island it gives them a recognizable region that residents name when they describe where they live.
Rhode Island closes under 8,000 single-family sales a year against roughly 280,000 owner households. Where do the next listings come from?
From the owners who did not sell, which is nearly all of them. That is the whole argument for reaching people earlier.
Rhode Islanders move less often than they used to, so the same house comes up for sale on a longer cycle. The owner who lists in 2031 is already checking what their home is worth, already looking at Barrington or Wakefield on weekends, and already telling nobody. Every one of those behaviors is observable if a partner is the one whose platform they are using.
Out-of-state buyers took 22.5% of Rhode Island sales. How do I reach them before they land somewhere else?
Out-of-state buyers accounted for 22.5% of all Rhode Island residential sales in the most recent year the Rhode Island Association of Realtors reported, and 41.1% of sales at $1 million or more. Most of them started searching from another state months earlier.
An agent working only local channels never sees that search. National coverage means a buyer in Massachusetts or Connecticut researching Tiverton or South Kingstown does it on the county partner’s co-branded platform, and their activity surfaces to that partner instead of routing to whoever bought the ZIP code that week.
More than one in eight Rhode Island sales came from Massachusetts buyers. How do I work that cross-border flow?
More than 12% of all Rhode Island sales went to Massachusetts buyers in the most recent year the Rhode Island Association of Realtors reported. They were crossing into a market whose single-family median rose from $425,000 to $499,900 over the last three years on record and still sits well below Massachusetts pricing. That price gap is structural rather than seasonal.
The practical move is to be present in the research phase, which happens on the Massachusetts side of the line. A Rhode Island partner cannot list in Attleboro, but they can be the local expert attached to the search a Bristol County buyer is already running, and they can take the referral fee on the Massachusetts home that buyer needs to sell.
Newport County’s population is falling while its median price is the state’s highest. Is that market worth my time?
Newport County’s population dropped 3.0% between 2020 and 2025 to 83,051, and its single-family median stands at $789,500, the highest of the five counties. Both numbers are real and they do not contradict each other. The county has fewer households than it did in 2020 and still has more buyers than it has listings.
It is also the county most exposed to the new state tax on non-owner-occupied homes assessed above $1 million, which RIPEC estimates will reach 9,000 to 10,000 properties statewide. Newport County averages about 50 days on market, the longest in Rhode Island, which means listings there need an agent who can market a home rather than one who relies on speed.
How should I talk to Rhode Island clients about the new tax on non-owner-occupied homes over $1 million?
Plainly, and with the mechanics right. From July 1, 2026, a non-owner-occupied Rhode Island property assessed at $1 million or more, and occupied by neither the owner nor a tenant for at least 183 days a year, owes $2.50 per $500 of assessed value above $1 million. A $1.5 million property owes roughly $2,500 annually.
The conversation that follows is the useful one. Some owners will absorb it, some will start renting the property past the 183-day threshold, and some will decide the carrying cost stopped making sense. Agents who can model all three outcomes with real property tax data get asked first.
Rhode Island’s housing stock has a median build year of 1964. How does that change how I work buyers here?
Rhode Island’s housing is the third-oldest in the country behind New York and Washington DC, per the state’s 2025 Integrated Housing Report, and Providence’s median build year is 1939. Lead paint disclosure touches nearly every transaction. Renovation financing comes up more often than it does in newer markets. Inspection reports surprise first-time buyers who expected a house from this century.
Only Charlestown, Exeter, Richmond, South Kingstown, and West Greenwich have housing that averages a build year of 1978 or later, and four of the five sit in Washington County. Keep that separate from new construction, which runs the other way: Providence opened 727 new units in 2025 and West Warwick 183, the two highest counts in the state. Send a buyer who wants a newer existing house to South County, and a buyer who wants something brand new to the urban core.
Every Rhode Island agent works off one statewide MLS. What is left to compete on?
Access to listings stopped being an advantage the moment every agent in the state saw the same feed at the same second. What is left is timing and relationship.
On timing, an agent needs to know which contacts are close to acting before they announce it, and that comes from watching real behavior rather than guessing at a list. On relationship, the agent who has already become the name a county associates with real estate wins before any comparison happens. NAR’s research is blunt about this: 81% of sellers contact only one agent, and 77% of repeat buyers interview only one.



Kurt Uhlir is a recognized leader in marketing, growth, and innovation, having helped scale companies and technologies used by millions every day—including at brands like eXp Realty, Sideqik, Vitrue, Oracle, Garmin, Facebook, Meta, Apple, and more. He’s trained tens of thousands of professionals on how to build trust, lead with service, and help clients make wise, informed decisions. At ez Home Search and Sure Send, his focus is on helping high-performing business owners, team leaders, and individual sales leaders grow their businesses through exclusive market access, privacy-first lead systems, and conversion-focused enablement tools.