

Oregon has 1,084,977 owner-occupied households and took in about 17,000 net new residents in the year to June 2025. Those two numbers say more about where Oregon real estate leads come from than any market forecast will.
The migration figure comes from Portland State University’s Population Research Center, the state’s official estimator. Set it against more than a million Oregon households that already own their home, holding $539 billion in value, on 2022 Census figures tabulated by the National Association of Realtors. The arithmetic points one direction. The business sits in the owner base.
That changes what a lead source has to do. It has to reach people who are not moving this year, stay useful while they wait, and surface them the month they start. Most lead sources are built for the opposite job.
Oregon hands an agent something no other state does. Its property tax system has drifted so far from market value that the taxable share runs from 41 cents on the dollar in one county to 63 cents in another, and almost no owner can work theirs out. That is a reason to be in touch every year with people who have no plans to sell.
What Oregon’s housing market is actually doing
Oregon’s market is steady, and what constrains it is supply rather than demand.

Start with closings, because transaction counts are what an agent gets paid on. In the six-county Portland region, detached single-family sales rose to 17,083 in 2025 from 16,872 the year before, on dollar volume of $11.7 billion against $11.4 billion. Median price moved from $595,000 to $599,990. Those figures come from RMLS data compiled by a certified residential appraiser who publishes annual reviews of the region with off-market entries stripped out. Statewide, the median sat at $484,700 in October 2025, up just under 1% from a year earlier, per Oregon REALTORS.
Homes took longer to sell. Average cumulative days on market in the Portland region stretched from 53 to 59, and months of supply averaged 2.9. Both things were true at once: buyers deliberated more, and there still was not much to deliberate over.
Those two measures get conflated constantly, so separate them. Months of supply counts the stock sitting on the market at a moment. Closed sales count the flow of deals over a period. Oregon’s stock is thin. Its flow is holding.
The supply side is where Oregon differs most from the rest of the country, and measured figures carry that point better than any projection does. Between 2013 and 2022 the state produced 0.84 housing units for every household that formed, according to analysis ECONorthwest presented to the Oregon Legislature in January 2025 using Census data. Permits over a rolling 12-month window fell 35% between January 2023 and 2024, from 21,676 to 14,074, with single-family down 7% and multifamily down 58%. Portland metro apartments under construction dropped from 4,400 at the end of 2023 to roughly 1,000 by late 2025, the fewest since 2011. Oregon’s vacant share of housing stock was 5.6% in the 2022 Census count. Nationally it was 9.7%.
Prices have outrun incomes, though by less than the coverage suggests. Since 1984, Oregon home prices are up 204% while median household income is up 196%, per FHFA and Census figures. Since 1980, prices have climbed faster in 11 other states than in Oregon. Oregon is expensive against local incomes and still sits mid-pack nationally on how fast prices have climbed.
The last piece is rate lock, and it explains why a lot of Oregon owners who would like to move have not. Work by Liebersohn and Rothstein for the National Bureau of Economic Research found that each percentage point the prevailing rate sits above a borrower’s original rate is associated with a 5.5% drop in the chance that household moves in a given quarter. Freddie Mac’s weekly average on the 30-year fixed ran from about 7.0% early in 2025 down to roughly 6.1% by that December, close to double what the same series recorded in 2020 and 2021. Oregon owners who financed in those years are the ones staying put.
Every one of those figures points at the same person. The Oregonian who transacts next is already living in the house.
Where Oregon’s economy is adding jobs and where it is shedding them
Oregon’s job base is rotating between sectors and between regions, and every rotation is somebody’s move.

Health care carries the growth. From January 2025 to January 2026, health care and social assistance added 9,800 jobs, a gain of 3.2%, while total nonfarm payrolls fell by 18,600. In the fourth quarter of 2025, private health care and social services accounted for nearly 14,500 job openings, close to a third of every opening in the state. Both figures come from the Oregon Employment Department. Manufacturing moved the other way and shed 4,000 jobs over the same twelve months. Construction added 1,000 in January 2026.
The semiconductor story sits almost entirely inside Washington County. Intel cut more than 3,000 Oregon positions during 2025: 1,521 at Ronler Acres, 519 at Jones Farm, 192 at Aloha and 160 at Hawthorn Farm, as reported by OPB and the Hillsboro News Times. Headcount at the company’s Oregon sites has come down from a peak near 23,000 to roughly 18,000. Pay in those roles averages around $110,000, which is why the effect reaches past the campus gates and into Hillsboro, Aloha and Beaverton. Some of those households will relocate for the next role. Some will stay and trade down. Both are people who need an agent months before they call one.
Head east and the direction reverses. Data centers employed about 7,800 Oregonians in 2025, with about as many again working construction and contracting for the industry, and communities around the state have designated something on the order of 9,100 acres for more, per OPB and the Lincoln Chronicle. Most of that build sits in Umatilla and Morrow counties, where Hermiston cleared the way for further development in September 2025. Housing has followed. The Hermiston Herald reported a 270-home subdivision going up on East Theater Lane, a 202-unit apartment building in Pendleton that filled faster than its developer expected, and new infrastructure opening 250 acres near Interstate 84.
The Willamette Valley runs on something else again. Oregon’s wine and wine grape industries generated $8.49 billion in economic impact in 2024, a gain of 3.8%, and supported more than 38,000 jobs, according to the Oregon Wine Board study released in February 2026. The valley holds 69% of the state’s planted vineyard acreage and 81% of its Pinot noir production. That puts a working agricultural economy inside an hour of Portland and puts Yamhill, Polk and Marion counties in a category of their own.
Underneath all of it, Oregonians keep starting things. The state recorded more new business registrations than any other in 2023. Establishment openings in 2025 ran roughly 30% above the 2015 level, and openings have outnumbered closings in each of the last ten years, per the Oregon Capital Chronicle and the Oregon Employment Department. Labor force participation has held near 63%.
Every one of those sectors produces the same thing from an agent’s side of the desk. Someone takes a job in Hermiston and needs a house. Someone takes a package in Hillsboro and decides to move closer to family in Bend. A cellar hand in McMinnville finally buys instead of renting. None of it reaches a lead feed until the person raises a hand, and by then they have usually already chosen somebody.
Oregon households are changing shape, and it shows up in the schools
Oregon is getting older and its households are getting smaller, and the school data reads that shift more clearly than anything else the state publishes.

Deaths outnumbered births in 27 of Oregon’s 36 counties, according to Portland State University’s Population Research Center in its 2025 annual report. Net in-migration is what kept many of those counties growing at all. Statewide, migration is now the only thing adding to Oregon’s population, because births keep falling.
The schools register the same shift earlier and in sharper detail. Public school enrollment has dropped by more than 37,000 students since 2020, after climbing every year from 2012 through 2019. The steepest year was 2020 to 2021, when 21,744 students left, followed by another decline of nearly 8,000. The Oregon Department of Education reports the counts, and OPB compiled the trend in November 2025.
Where those students went is the part nobody can fully answer. A Brookings Institution analysis found 12% of Oregon’s school-aged children unaccounted for, living in the state but appearing on neither public nor private enrollment rolls, the highest share of any state in the country. The number of families homeschooling rose 72% in the pandemic’s first two years, per the state education department.
For an agent, that shift has an address. Oregon has 197 school districts, and demand inside them keeps redistributing. A family weighing Lake Oswego against West Linn, or Bend-La Pine against Redmond, or Corvallis against Philomath, asks a school question first and a house question second. That has always been true here. What changed is that the answer keeps moving, and the sources most families reach for have not kept up with it.
The same shift is rearranging who owns what. Fewer children per household across much of Oregon leaves more owners in their fifties and sixties holding four-bedroom houses they bought for a family that has since scattered. Statewide, 76% of Oregon householders aged 55 and over own their home, on 2022 Census figures compiled by the National Association of Realtors. That is the largest and least-worked seller pool in the state, and it will not announce itself.
The agent who can answer the district question with real numbers instead of an opinion is the one who gets the second phone call.
Oregon taxes homes on about half of what they are worth, and the half varies by county
Statewide, Oregon’s taxable assessed value came to 52.6% of real market value in fiscal year 2024-25, up from 51.5% the year before. That figure belongs to the Oregon Department of Revenue, published in its annual property tax statistics report, and it may be the most useful number an Oregon agent can carry into a listing appointment.
Two ballot measures produced it. Measure 5, passed in 1990, caps the tax rate. Measure 50, passed in 1997, did something stranger. It reset every property’s assessed value, the figure tax is calculated on, to what the property was worth in 1995-96 minus 10%, then capped growth in that assessed value at 3% a year regardless of what the market did. Real market value has climbed at market speed ever since. Assessed value has crawled at 3%. The two have been pulling apart for close to thirty years.
The League of Oregon Cities states the consequence plainly in its most recent property tax report. Tax bills, it notes, “will differ by thousands of dollars for properties that have the same real market value.” Take two houses on one street: same size, same condition, same sale price. Their owners write very different checks in November. The difference traces back to when each house last changed hands or was substantially improved.
The gap is uneven across Oregon, which is where it becomes useful. Deschutes County taxes property on 40.7% of its market value. Douglas County taxes on 63.0%. Hood River sits at 41.8%, Jefferson at 42.8%, Multnomah at 49.7%, Josephine at 62.0% and Malheur at 63.7%. Those shares come from dividing each county’s assessed value by its Measure 5 value in the Department of Revenue’s fiscal 2024-25 tables.
Effective rates spread just as far. Per $1,000 of market value, Curry County averages $5.02 and Wallowa $5.08, while Multnomah averages $11.71. Statewide the figure is $9.18. On a $600,000 house that works out to roughly $3,000 a year in Curry County against roughly $7,000 in Multnomah, on identical market value.
| County | Population | County seat and principal cities | Assessed value as a share of market value | Effective rate per $1,000 of market value |
|---|---|---|---|---|
| Multnomah | 801,477 | Portland; Gresham, Troutdale, Fairview | 49.7% | $11.71 |
| Washington | 603,947 | Hillsboro; Beaverton, Tigard, Tualatin, Forest Grove, Sherwood | 56.0% | $10.06 |
| Clackamas | 423,975 | Oregon City; Lake Oswego, Milwaukie, West Linn, Happy Valley, Wilsonville | 55.6% | $9.82 |
| Lane | 384,207 | Eugene; Springfield, Cottage Grove, Florence, Junction City | 50.1% | $8.32 |
| Marion | 349,244 | Salem; Keizer, Woodburn, Silverton, Stayton | 55.1% | $9.41 |
| Jackson | 222,645 | Medford; Ashland, Central Point, Eagle Point, Jacksonville | 59.9% | $8.49 |
| Deschutes | 206,334 | Bend; Redmond, Sisters, La Pine | 40.7% | $6.76 |
| Linn | 130,706 | Albany; Lebanon, Sweet Home, Harrisburg, Brownsville | 55.1% | $9.39 |
| Douglas | 112,072 | Roseburg; Sutherlin, Winston, Myrtle Creek, Reedsport | 63.0% | $6.98 |
| Yamhill | 108,734 | McMinnville; Newberg, Dundee, Carlton, Amity | 51.7% | $7.70 |
County population from US Census Bureau American Community Survey 2024 five-year estimates. Value share and effective rate computed from Oregon Department of Revenue property tax statistics, fiscal year 2024-25.
Some scale for why this carries weight. Residential property makes up 51% of all assessed value in Oregon, or 60% counting land held for residential development. Clackamas, Multnomah and Washington counties together hold 54% of the state’s residential value and pay 54% of the tax. Property taxes imposed statewide reached $9.54 billion in fiscal 2024-25 and have grown an average of 5.1% a year since Measure 50 took effect.
Two older findings deserve naming, both attributed and both dated. Research by The Oregonian in 2015 found that 57% of Portland-area homeowners would pay less under a system based on market value. A 2014 study from the Northwest Economic Research Center at Portland State University concluded that Oregon’s property tax system affects what single-family homes sell for. That second one is the finding agents feel without naming. A buyer carries the tax bill on top of principal, interest and insurance, so the bill shapes the offer.
This is where the ez Home Search property-tax capability earns its keep. The platform pulls tax figures at the state, county, city and ZIP code level and sets them side by side, then runs them against an automated valuation model, an AVM, which is a computed estimate of what a property is worth today. An owner sees what the home costs to hold, beyond the sticker price. In Oregon that combination answers a question almost no owner can answer alone.
Oregon has 36 counties and room for one ez Home Search partner in each. Check whether yours is still open.
The buyer you are chasing is usually the seller you want
Most Oregon agents run two campaigns for what is usually one person.
One campaign says list with me and goes out to homeowners. The other buys buyer leads. They run on separate budgets and separate scripts, sometimes with separate people on the team. Meanwhile the household on the receiving end is doing both things at once.
The Profile of Home Buyers and Sellers, the annual survey the National Association of Realtors runs, puts first-timers at about one in five purchases nationally, close to the lowest share it has recorded. Oregon publishes no clean equivalent, so the national figure is the anchor here and stays labeled national. Turn it over and the other four in five are people with a home to sell before they can close on the next one.
Be precise about what that says. Any one address has two parties, and they are not the same household. What repeats is the individual: across a single move, most people occupy both roles in turn. The buy side comes first for nearly all of them. An owner prices the next house before deciding to list the current one, which is why the agent who shows them what their money buys is so often the agent who ends up taking the listing. The agent who markets for listings and nothing else hands that whole sequence to somebody else.
Now size the seller pool, because a shortage of Oregon sellers is the most common and least accurate thing said about this state. Oregon has 1,084,977 owner-occupied households holding $539 billion in owner-occupied value. Those owners are in unusually good shape. In the first quarter of 2024, 2.2% of Oregon mortgages were past due against 3.6% nationally, and 0.3% were in foreclosure against 0.5%, per Mortgage Bankers Association data compiled by the National Association of Realtors. Oregon sellers list on their own timetable.
Three groups sit inside that pool, and each needs something different.
- First-time buyers, about one in five purchases, have no home to sell. They need affordability math, plain-language education, and confidence.
- The dual majority, the other four in five, are trading up, down or sideways. What they need is the equity they are sitting on, a clear read on how the two closings line up, and one agent running both halves as a single move.
- Seller-only owners are the smallest group. Think of an estate, a landlord winding down a rental, a parent moving in with adult children.
What ez Home Search does with that is read behavior instead of guessing. Someone who runs a valuation, then runs it again four weeks later, or lands on a home-value page, has opened the seller conversation whether they say so or not. Someone who reopens a saved search, reads every alert the morning it arrives, and books a tour is moving on the buy side. Most households run both sequences in turn, and the platform follows the handoff without filing the person as a buyer or a seller up front.
The early part of that sequence is private, and it is often long. A person dreams, then gathers information, then plans, then acts. One spouse will watch the house’s value and browse listings for half a year before the subject ever comes up at dinner. A homeowner facing a major change at home may work the numbers for the better part of a year before telling a soul. Nobody does that research somewhere that converts a single search into a week of phone calls. That confidentiality is why the partner behind the platform is already the trusted name when the person is finally ready to act, on both sides of the move.
What Oregon agents use to find business now, and where each of those runs out
Every method below works. Each one also has a ceiling, and the ceilings are structural, so no amount of effort moves them.
Shared leads. Vendors sell Oregon seller and buyer leads by county and by individual ZIP code, down to 97045 in Oregon City. The volume is real and it arrives fast. The ceiling shows up in three places: your competitors bought the identical record, the household picked nobody, and no one anywhere in the chain holds documentation that the household agreed to a call. What you bought was a race.
Your own IDX website. An internet data exchange feed puts live listings on an agent’s own website, which is a reasonable thing to own. The ceiling is that it compounds slowly and needs constant attention, and the pieces consumers actually return for, accurate valuations and deep school and tax detail, sit behind data and engineering costs no single team or brokerage can carry.
Cold calls and dialers. Few agents realize that a prospecting call or text puts them under the Telephone Consumer Protection Act, which treats them as telemarketers from the first dial. Dispute a call and the person disputing it proves nothing; the agent has to produce documented consent for the number, one number at a time. A single undocumented text is worth $500 to whoever received it, or $1,500 where a court finds the violation willful, and nothing caps the total. Suits of this kind more than doubled in 2025 and most arrived as class actions. A ten-agent team that pushes 3,000 calls through a dialer and cannot document consent on 2,000 of them starts its exposure near $1 million.
Predictive seller scores. Software ranks the names in a database and predicts which owners will list next. Those predictions are often directionally right. The ceiling is that scoring somebody highly does not make them know you. Someone still has to earn the trust that turns a probability into a signature, and that someone is the agent.
Generic all-in-one platforms. They promise every tool in one login. The ceiling is that somebody has to configure and administer them, and that somebody is usually the agent who was supposed to be with clients.
Paid search, social retargeting and direct mail. All three put a name in front of people who might be looking. The ceiling is that nobody bookmarks a postcard. Outbound is all any of them can do, and a past client has nowhere in them to return to.
The mechanism ez Home Search runs on differs in one specific way. It serves the whole lifecycle of owning a home rather than the sliver of people transacting this month. At any moment the share of people inside a transaction tops out around 5% to 10%. Everyone else is living in a home, paying for it, maintaining it, watching what it is worth, weighing a refinance, or thinking about someday. The platform is built for all of them, co-branded to the county partner, so the partner’s name rides on the search itself, on the listing alerts, on the home value updates and on the local market reports those people use for years. When someone’s own activity says they are getting close, the partner hears about it.
The honest trade belongs on the table before anyone gets excited. A partner pays one fee they can predict. Nothing is charged per name and nothing is deducted at closing, so a heavy month shows up in the partner’s income instead of the invoice. The same arrangement holds that fee steady through a light month, which is the part an agent used to buying volume by the unit has to weigh.
What changed for Oregon agents in 2025 and 2026
Oregon rewrote how an agent attaches to a client and how teams get supervised, and both changes reward the agent who was already known.
Since January 1, 2025, Oregon has required a written representation agreement before an agent works with a buyer. The effect is that the value conversation now happens before the first door opens. An agent who arrives a stranger has to make that case cold, in a driveway, to somebody who has not decided anything yet. An agent whose market updates that same buyer has been opening for two years has a much shorter conversation.
HB 3137 is the larger change. Signed in June 2025 and effective January 1, 2026, it creates a designation called the managing principal broker. The role belongs to a principal real estate broker who has registered or assumed responsibility for a business name. That person then carries ultimate responsibility for the professional activity of every associated broker and every branch office under it. Team oversight tightens. The words “real estate” and “realty” are barred from team names, though the legislature may revisit that point. Education requirements now include a standalone state and federal fair housing course, with other continuing education hours rebalanced around it. Stoel Rives and the Oregon Real Estate Agency have each published summaries worth reading before January.
Oregon also does not allow continuing education carryover. Finish 40 hours in a cycle that required 30 and the extra ten evaporate; nothing banks forward.
One more change matters mostly outside the metros. SB 83, passed in the 2025 session, repealed Oregon’s statewide wildfire hazard map along with the property maintenance rules attached to it, and replaced the minimum defensible space standards with a model code the State Fire Marshal develops for local jurisdictions to adopt if they choose. The map had been in place since 2022 and had drawn complaints from rural owners about insurance costs and property values. For an agent listing acreage in Josephine, Klamath, Wasco or Union County, the disclosure conversation shifted, and clients will ask about it.
The direction across all of it is consistent. Oregon keeps raising the cost of meeting a client for the first time at the moment of the transaction. Every one of these changes pays the agent who was already there.
Oregon’s regions do not move together
Oregon runs six regions with six sets of conditions, and an agent who reads the state as one market will price and prospect wrong in most of them.
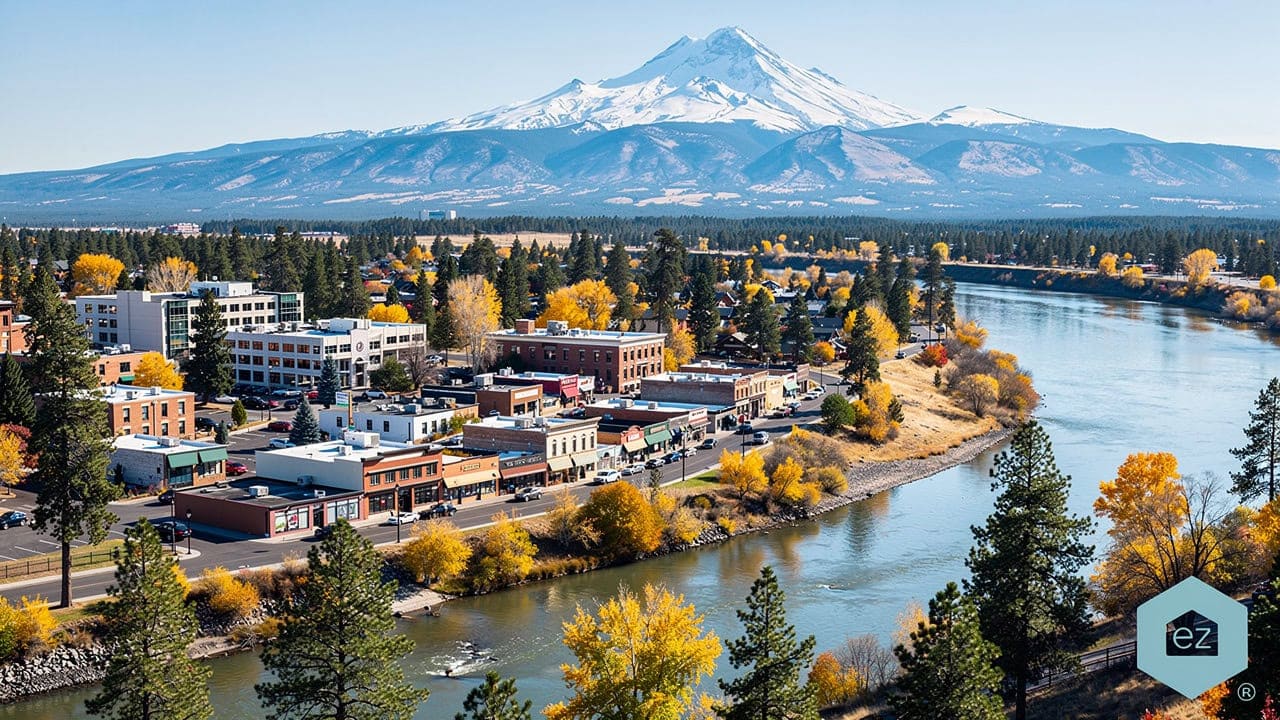
Portland metro. The six-county region recorded 17,083 detached single-family closings in 2025. Multnomah accounted for 6,459, Washington 5,046 and Clackamas 3,986, which put 90.68% of regional sales in three counties. Yamhill added 964, Columbia 487 and Hood River 141. The highest-volume ZIP code in 2024 was 97229, covering Cedar Mill and Bethany across the Multnomah and Washington county line, with 729 homes sold; the most expensive was 97034 in Lake Oswego. Those counts come from RMLS data cleaned and published by a regional appraiser, so read them as one analyst’s dataset, short of an official tally.
Willamette Valley. The entire valley sits below the national rental vacancy rate, per Census figures ECONorthwest presented to the Oregon Legislature in January 2025. Renter cost burden, meaning a household spending more than 30% of gross income on rent, runs 56% in Eugene and 54% in Salem, with Gresham at 61%, Medford at 55%, and Portland and Bend both at 50%. Cost burden is a buyer-pool indicator. It tells an agent who wants out of renting and cannot get out yet.
Central Oregon. Bend’s median ran between $700,000 and $731,000 from late 2025 into January 2026, moving roughly zero to 1.6% on the year, on 3.5 to 3.8 months of inventory that The Bulletin described in December 2025 as the healthiest supply since 2019. Redmond‘s median was $510,000 in November 2025, up $19,000 on the year, on about a month and a half. Deschutes County leads Oregon in population growth at 5.55%. These are single-source figures from local reporting and are worth confirming before anyone builds a listing presentation on them.
Southern Oregon. Jackson County inventory rose nearly 24% year over year and Josephine County more than 30%, per Grants Pass reporting in 2026, which is the only published source carrying those counts. Medford’s median of $414,700 is the lowest among Oregon’s dozen busiest markets. Buyers there have choice they have not had in years, sellers wait longer, and prices keep edging up anyway.
Oregon Coast. Second and vacation homes make up an unusual share of the housing stock here, and the rules on how those homes may be used are set town by town rather than in Salem. A coastal listing’s numbers now depend on which side of a city limit it sits.
Columbia Gorge and Eastern Oregon. Growth here is being built more than it is being moved in. Data center construction across Umatilla and Morrow counties pulled in workers, and housing followed: 270 homes going up on East Theater Lane in Hermiston, a 202-unit apartment building in Pendleton that filled faster than its developer expected, and 250 acres opened for development near Interstate 84.
| Region | The trend that defines it right now |
|---|---|
| Portland metro | Detached closings rose to 17,083 in 2025 from 16,872 in 2024, median up 0.84% to $599,990, average days on market lengthening to 59 (RMLS data via a regional appraiser’s annual review, February 2026) |
| Willamette Valley | The entire valley sits below the national rental vacancy rate, with renter cost burden at 56% in Eugene and 54% in Salem (Census ACS 2023, via ECONorthwest to the Oregon Legislature, January 2025) |
| Central Oregon | Bend held a median between $700,000 and $731,000 into January 2026 on 3.5 to 3.8 months of inventory, its healthiest supply since 2019; Redmond reached $510,000 in November 2025 (The Bulletin, December 2025) |
| Southern Oregon | Jackson County inventory rose nearly 24% year over year and Josephine County more than 30%, with Medford’s $414,700 median the lowest among Oregon’s dozen busiest markets (Grants Pass Tribune, 2026) |
| Oregon Coast | Second and vacation homes make up so much of the stock that removing them moves Tillamook’s housing-units-per-household ratio from 1.62 to 1.07 and Lincoln’s from 1.42 to 1.10 (Census ACS 2023, via ECONorthwest, January 2025) |
| Columbia Gorge and Eastern Oregon | Data centers employed about 7,800 Oregonians in 2025, and communities statewide have designated roughly 9,100 acres for more, concentrated in Umatilla and Morrow counties (OPB, September 2025; Lincoln Chronicle) |
A single statewide script fails against that spread. The Bend conversation is about choice for the first time in six years. The Medford conversation is about a buyer who finally has room to negotiate. In Hermiston it is about a job that started last month, and in Portland it is about a tax bill that drifted away from the price years ago. An agent who owns one county can hold all of that. An agent trying to cover Oregon cannot.
The counties beyond the metros, where a name still travels
Most of Oregon’s counties are small enough that one recognized name can cover the whole county, and in several of them a large share of the owners do not live there.
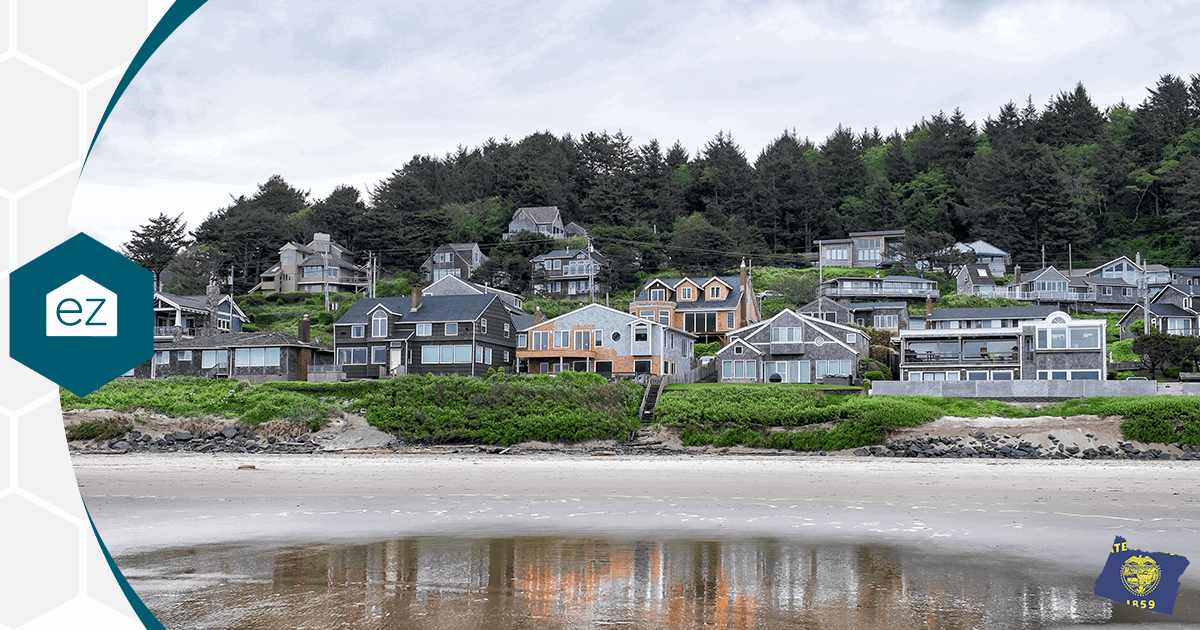
Start with the second-home number, because it is the sharpest county-level fact in Oregon housing data. Census figures presented to the Oregon Legislature in January 2025 show what happens when second and vacation homes come out of the housing stock. Tillamook County drops from 1.62 housing units per household to 1.07. Lincoln drops from 1.42 to 1.10. Wallowa goes from 1.29 to 1.11, Clatsop from 1.28 to 1.04, Jefferson from 1.21 to 1.06, and Deschutes from 1.17 to 1.04. Statewide the adjustment takes Oregon to 1.05 units per household against a national 1.11 before any adjustment, which leaves Oregon the second most constrained housing market in the country.
Said plainly: in those six counties a large fraction of the houses belong to somebody who sleeps somewhere else most of the year. Those owners are their own market. They track the value of a property they do not live in, they think about carrying costs more than a primary-residence owner does, and they react fast to a rule change.
The rules are changing. Clatsop County adopted an 8% cap on short-term rentals in unincorporated areas through Ordinance 26-03 on January 28, 2026. Cannon Beach limits new short-term rental permits to 14 days a year. Lincoln City‘s median reached $576,500 in October 2025 under vacation rental rules looser than those in the unincorporated county around it, a single-source figure from local coverage that deserves confirming, though the pattern behind it holds: two towns twenty minutes apart can now carry completely different investment math.
An owner in Beaverton who holds a rental in Rockaway Beach will not learn about a Tillamook County rule change from a Tillamook County postcard. They will learn about it wherever they already track that property. That is the argument for a platform that follows an owner instead of a mailing route.
| County | Population | Communities |
|---|---|---|
| Benton | 96,303 | Corvallis, Philomath, Adair Village, Monroe |
| Polk | 89,662 | Dallas, Independence, Monmouth, Falls City |
| Josephine | 88,179 | Grants Pass, Cave Junction, Merlin, Wolf Creek |
| Umatilla | 79,940 | Pendleton, Hermiston, Milton-Freewater, Stanfield |
| Klamath | 70,247 | Klamath Falls, Chiloquin, Merrill, Bonanza |
| Coos | 64,827 | Coos Bay, North Bend, Bandon, Coquille, Myrtle Point |
| Lincoln | 50,964 | Newport, Lincoln City, Depoe Bay, Waldport, Yachats |
| Clatsop | 41,363 | Astoria, Seaside, Warrenton, Cannon Beach, Gearhart |
| Wasco | 26,552 | The Dalles, Dufur, Mosier, Maupin |
| Hood River | 23,905 | Hood River, Cascade Locks, Odell, Parkdale |
County population from US Census Bureau American Community Survey 2024 five-year estimates. City-in-county assignments verified against the Oregon Secretary of State’s Blue Book incorporated-cities listing. Merlin and Wolf Creek in Josephine County, along with Odell and Parkdale in Hood River County, are unincorporated communities rather than incorporated cities.
The same logic runs inland with different specifics. Umatilla and Morrow are absorbing data center growth and the households that come with it. Malheur and Douglas sit near the top of Oregon’s taxable-value range, at 63.7% and 63.0%, which means owners there feel a property tax increase far more directly than a Deschutes County owner does. Benton runs on a university and Polk on the state capital next door. Curry carries the lowest effective tax rate in the state at $5.02 per $1,000 of market value, and Coos holds the working end of the same coastline. Josephine’s listing count rose more than 30% in a year on the Grants Pass Tribune’s figures. Wasco and Hood River split the Gorge between orchards, wind and recreation.
In a county of 27,000 people, one agent can still turn into the name everyone reaches for, which will never be true of Multnomah, and that position keeps paying on every transaction for as long as they hold it.
Remote and hybrid work keeps sending buyers into Oregon’s smaller counties
The coverage says remote work is over. The federal data says it settled.

The Bureau of Labor Statistics logged 36.7 million teleworkers for the last quarter of 2024, people working from home at least occasionally. Twelve months earlier the same count stood at 32.5 million. That is a gain, logged during the stretch everyone described as the return to the office. The Census Bureau then ran the largest employer-side study ever conducted on the question, surveying about 150,000 US firms, and found that 31.2% of them had somebody putting in a full workday from home. Asked to look five years ahead, those employers described the same picture. Pew Research Center found in October 2024 that 75% of US employees with a job that can be done from home are doing some of it there.
The two stories disagree because of a baseline. Measured against May 2020, remote work collapsed. Measured against 2019, it roughly tripled and stayed there.
What that does to land is the part Oregon agents can use. The US Department of Agriculture’s Economic Research Service counted a net 974,000 people moving into rural counties over 2020 through 2024. That ended a losing streak more than a decade long, and the arrivals skewed young: adults from 25 to 44, not retirees. Those are working-age people who brought their income with them.
Oregon has one measurable advantage here that almost nobody cites. In the 2022 Census count, 73.5% of all Oregon households had high-speed internet, against 68.6% nationally, on figures compiled by the National Association of Realtors. The geography positioned to absorb the shift sits outside Portland, in Benton, Polk, Josephine, Wasco, Union and Hood River counties, in the smaller Willamette Valley cities, along the Gorge, and on the coast.
The buyer who arrives that way carries a different list. First on it is a work space with a door on it, either a room inside the house or a separate structure, an accessory dwelling unit, out back. Square footage matters more to them than it did to the commuting version of the same household. And broadband has to hold a video call, which in a rural Oregon county is a street-by-street question the agent should be able to answer before anyone asks it.
Most agents, teams and brokers in Oregon have written this trend off and are prospecting accordingly. That is the opening.
Counties go to one partner at a time. Start the conversation about yours.
What an Exclusive County Partnership actually gives an Oregon agent

A county goes to exactly one agent, team or brokerage. Their brand sits on the consumer experience across that whole county, and ez Home Search puts nobody else inside the line. Everything else follows from that structure.
The economics are worth stating early because they run against the category. The partner owns the leads. Nothing is priced by the name and nothing comes off the top of a closing. A busy quarter in Deschutes County shows up in the partner’s income rather than in what they owe.
The connections convert differently because of where they come from. The person arrives having already used the platform and shown real activity on it. The agent opens the first conversation already knowing the kind of home they kept opening, the neighborhoods they searched again and again, and the tour they finally asked for. Weeks of the usual trust-building are already behind them before either one says a word.
The biggest return, though, is already sitting in a database the partner owns today. Go back to the Profile of Home Buyers and Sellers and the numbers on how people pick an agent are lopsided. Sellers contact a single agent 81% of the time. Repeat buyers interview only one in 77% of cases. Reputation outranks every other factor a seller weighs, and 35% name it first. Most clients never run a comparison at all, so the familiar local name has won before the shopping stage everyone assumes exists. Our own numbers put a figure on what that position is worth. Partners reactivate past clients, repeat purchases and referrals both, 2.5 to 5 times the market rate.
Databases decay on their own. Somewhere between 15% and 22% of the email addresses in a list go dead over twelve months, and up to one person in ten swaps a phone number in the same span. That erosion stops when the list keeps using the co-branded search, opening the home value updates and reading the listing alerts, because every visit hands over a working address and a live number. Nobody has to run a cleanup.
Relocation matters more in Oregon than in most states, given how much of the movement here is one county to another. In a given year, Census figures have roughly 2.1% of the country moving across a state line and close to another 3% moving between counties inside one state. Say a past client in Bend starts pulling up Boise listings. That search runs on the partner’s own co-branded experience instead of a legacy real estate portal, so it registers, and the partner calls before the Bend house goes to somebody else. Take national coverage away and both the client and the listing vanish with no warning at all.
The school and tax depth answers the two questions this article already raised. ez Home Search covers more than 149,000 schools with reports at the state, county, school-district and individual-school level, each carrying its own rating and, where they exist, written reviews from parents. A district page shows average prices for single-family homes, condos and townhomes by ZIP code and neighborhood inside that district. Set that against Oregon’s 197 school districts and an enrollment picture that keeps moving, and the partner holds the answer the family is actually searching for. The property tax lookup by state, county, city and ZIP does the same job against Measure 50.
ezVerify.ai takes the legal risk out of the outreach. Opt-in is confirmed and a recording is kept as evidence of it. Every number is screened against a known-litigator database and suppressed if it sits on the Do Not Call registry, all before a call is placed, and the contact detail an agent normally has to dig up arrives already filled in. That is documentation rather than a lead score, and it means the riskiest part of the job arrives already handled.
The conversion tools are built and running from day one, co-branded, because they come from ez Home Search’s own national platform, so the partner assembles nothing. A few clicks produce an AVM widget for the partner’s own site. A few more produce a QR code that signs visitors in at an open house, a home-value page, or an instant cash offer aimed at an Oregon owner who would rather sell quickly than list. None of it lands in a separate inbox either, because ez Home Search is CRM agnostic: a contact’s activity surfaces wherever the partner already works, fullest in Follow Up Boss, where ezNurture runs the automated follow-up inside the platform, and deepest in Sure Send. Support comes with it. Real people work on the partner’s results through coaching every week, a set of sales enablement playbooks, and the Shut Up and Dial events.
Partners holding a county exclusivity tend to say the same thing about their first ninety days. The surprise is how much was already sitting in the database they had.
Counties get claimed one at a time

Each Oregon county carries a single partner and no more, so whether yours is available changes month to month.
Oregon has 36 of them. Some are already claimed, more get taken each month, and the model works the same in Multnomah as it does in Wallowa. The name people already know is worth as much in a county of 7,553 as it is in one of 801,477. The one thing the model will not do is scale by adding agents inside a territory. There is a single partner, and the territory belongs to them.
That scarcity works as a plain constraint rather than a sales device. Demand for exclusivity has generally run ahead of the counties available, and once a partner holds the position, the recognition compounds year over year in a way no competitor can copy from outside no matter what they spend on it.
Why the model can hand a whole county to one partner comes down to how the consumer side is built. Under The Only Confidential Home Search, what a person enters, their contact details and what they can spend, is never put up for sale, passed around a second time, or pushed out to a crowd of companies they did not pick. One Single Local Expert receives it, someone who knows the area and was matched to what that household needs. ez Home Search names the promise outright: A Better Way To Discover Real Estate. Oregon owners get a search built to keep it.
Be precise about the limits of that promise. It does not mean literal secrecy, and it does not mean a person’s information never goes anywhere. What a person enters reaches a single vetted county partner, the one who serves that area, and the household knows the moment it happens and who received it.
The preference underneath it is broad and it keeps growing. Pew Research Center surveyed more than 5,000 US adults in 2023. Of them, 81% said they were worried about what companies do with the information collected on them, and 73% said they had little or no say over it. About half had walked away from a product or an app on privacy grounds. More than four in ten had moved to a search engine or browser built not to follow them around.
Companies built around that expectation have done well by it. DuckDuckGo and Brave each grew to around 100 million users by making privacy the default. Proton built email the company itself cannot read and passed 100 million accounts. Apple made privacy a pillar it builds products around. 1Password and Bitwarden went further still, engineering their vaults so the company holding them has no way to see inside. Real estate was among the last industries this reached, and ez Home Search got here first.
An Oregon owner who has spent a decade locking down the rest of their digital life will not hand their budget to a form that sells it. They will use the search that does not, and the partner’s name will be sitting on it.
What this comes down to for your county
Most Oregon agents are running the first of three plays. They keep buying names alongside three or four other agents who bought the same name, and they keep paying by the unit in a state where price appreciation stopped doing the work for them. It produces volume. It also produces a race that gets won some of the time.
The second play is to build the thing yourself. That means a search experience people return to, a valuation model accurate enough that owners check it twice, school data at the district level across Oregon’s 197 districts, property tax detail county by county, consent documentation that survives a dispute, and follow-up automation running on top of all of it. The stack costs millions before it produces one lead, and the underlying data alone is priced past what almost any team or brokerage can reach.
The third play is to hold one county on a platform that already has every piece of that built and running, with your name across the whole experience.
The third path carries an honest cost that belongs on the table before anyone signs anything. The cost arrives as one predictable fee, never a price per name, which means it is still there in a slow quarter. And it does not pay in a week. Expect 30 to 60 days of consistent follow-up before the conversion pattern shows up in your numbers. An agent who needs this week’s closing will find that uncomfortable. An agent building a five-year position in Linn or Josephine or Clatsop County will find it cheap.
One number carries the case, so it is the only one worth ending on. ez Home Search partners reactivate past clients, the second transaction and the referral alike, 2.5 to 5 times the market rate. Every bit of it was earned once already and then left uncollected.
Which returns this to where it started. Oregon took in about 17,000 net new residents in the year to June 2025 and holds 1,084,977 households that already own the roof over their heads. The state’s next decade of transactions is sitting inside houses that are already occupied, in counties where one name can still become the name.
See which Oregon counties are still unclaimed.
Frequently asked questions
Why do two Oregon homes worth the same amount get completely different property tax bills?
Because Oregon taxes assessed value, not market value, and Measure 50 froze the relationship between the two back in 1997. Assessed value was set at 1995-96 market value minus 10% and capped at 3% annual growth from there, while market value kept doing whatever the market did. A house that has sat in the same family since the nineties and a house next door that was rebuilt in 2019 can sell for the same number and carry very different tax bills.
Statewide, taxable assessed value came to 52.6% of real market value in fiscal 2024-25, per the Oregon Department of Revenue. The share by county runs from 40.7% in Deschutes to 63.7% in Malheur. Sellers rarely know their own position, and buyers almost never do. The agent who can pull that comparison by county, city and ZIP holds something worth more in Oregon than in any other state.
What does HB 3137’s managing principal broker requirement change about how an Oregon team handles leads in 2026?
It puts one named person on the hook for everything the team does. Effective January 1, 2026, the managing principal broker is a principal real estate broker who has registered or assumed responsibility for a business name, and who carries ultimate responsibility for the professional activity of every associated broker and every branch office under it. Team oversight tightens, and “real estate” and “realty” are barred from team names.
For lead handling, the practical effect is that loose, undocumented prospecting stops being an individual agent’s problem and becomes the managing principal broker’s problem. A lead source that arrives with documented consent and a screened phone number is worth considerably more under that structure than it was in 2024.
Now that Oregon requires a written buyer representation agreement before showings, how do I reach buyers early enough to earn that signature?
By being present before the buyer starts touring. Oregon has required a written representation agreement since January 1, 2025, which moves the value conversation to a driveway with somebody who has not committed to anything. A stranger has to win that conversation cold.
The alternative is to be known already. A buyer who has been using a co-branded search, opening your listing alerts, and reading your market updates for two years is not evaluating you from scratch. ez Home Search partners get that position by default, because the search experience, the alerts and the home value updates carry the partner’s name across the whole county, for years before anybody needs to sign anything.
Where do Oregon listings come from if the state only adds about 17,000 people a year?
From the 1,084,977 households that already own here. Portland State University’s Population Research Center put net migration at roughly 17,000 for July 2024 to June 2025, which is small next to an owner base holding $539 billion in owner-occupied value. Oregon’s transactions come from turnover inside that base. Very few come from outside it.
That is also why nobody should describe Oregon as short of sellers. Nationally, first-time buyers account for about one in five purchases. The remaining four in five arrive with a house of their own to move first. Most of them start by looking at what their money buys, months before they ever consider listing. Reach them then and the listing follows.
Is Central Oregon still worth farming now that Bend has the most inventory it has had since 2019?
Yes, and the case is stronger now than it was two years ago. The Bulletin reported in December 2025 that Bend held 3.5 to 3.8 months of inventory, the healthiest supply since 2019, with the median running between $700,000 and $731,000. Redmond sat at $510,000 in November 2025 on about a month and a half. Deschutes County still leads Oregon in population growth at 5.55%.
More inventory means buyers deliberate, compare and take advice, which raises the value of an agent they already trust. Deschutes also has the lowest taxable-value share in the state at 40.7% of market value, so Central Oregon owners hold an unusually wide gap between what their home is worth and what it is taxed on. That is a conversation worth having every year with people who are not selling yet.
With Clatsop County capping short-term rentals and most coastal owners living inland, where does an Oregon Coast agent find business?
By serving the owners where they actually live. Strip second and vacation homes out of the stock and Tillamook County goes from 1.62 housing units per household to 1.07, Lincoln from 1.42 to 1.10, and Clatsop from 1.28 to 1.04, per Census figures presented to the Oregon Legislature in January 2025. A large share of coastal owners sleep somewhere else most of the year.
The rules keep moving under them. Clatsop County adopted an 8% cap on short-term rentals in unincorporated areas through Ordinance 26-03 in January 2026, and Cannon Beach limits new short-term rental permits to 14 days a year. An owner in Beaverton or Hillsboro will not hear about that from a coastal mailer. They will hear about it on the platform where they already watch that property, which is exactly what a co-branded national platform is for.







Kurt Uhlir is a recognized leader in marketing, growth, and innovation, having helped scale companies and technologies used by millions every day—including at brands like eXp Realty, Sideqik, Vitrue, Oracle, Garmin, Facebook, Meta, Apple, and more. He’s trained tens of thousands of professionals on how to build trust, lead with service, and help clients make wise, informed decisions. At ez Home Search and Sure Send, his focus is on helping high-performing business owners, team leaders, and individual sales leaders grow their businesses through exclusive market access, privacy-first lead systems, and conversion-focused enablement tools.